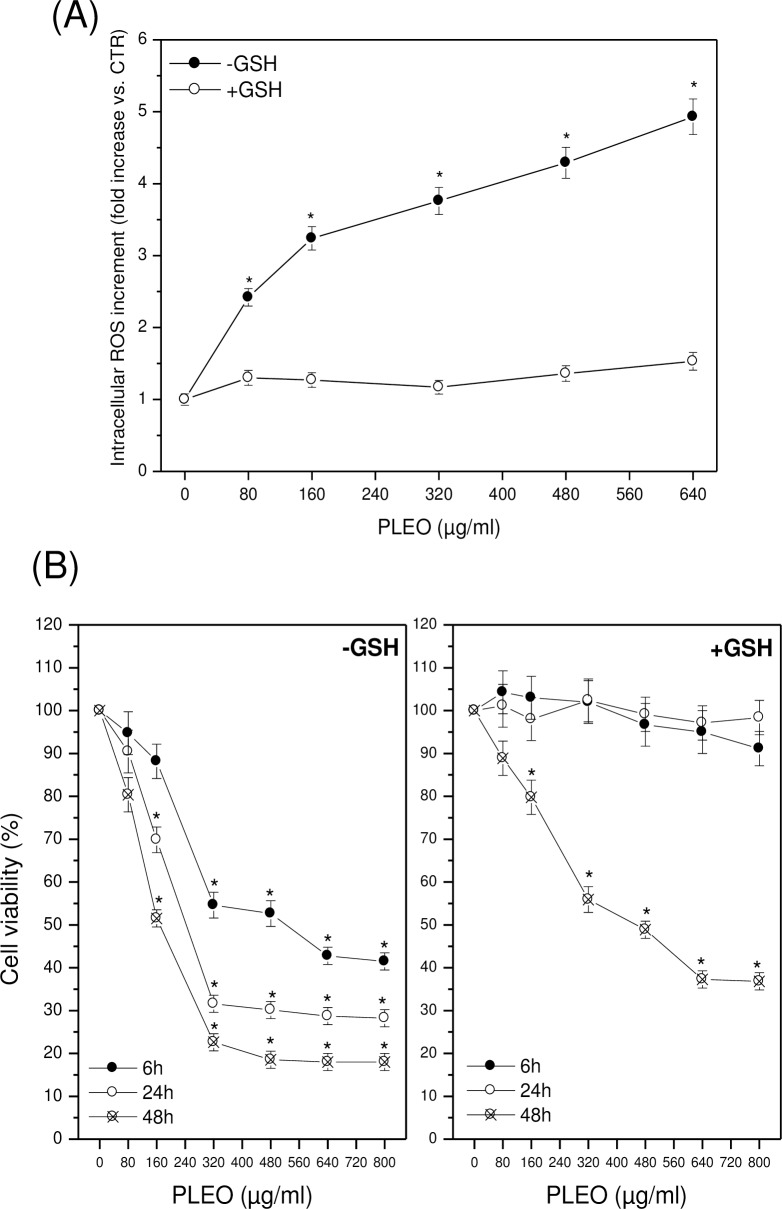
Fig 3.
(A) Intracellular ROS levels after 6 h of PLEO administration (0.01–0.08% v/v, 80–640 μg/ml) to FTC-133 cells in the presence of GSH 5 mM. (B) Cell viability after 6, 24, and 48 h of PLEO administration to FTC-133 cells in the presence of GSH 5 mM. Data are expressed as mean ± SD (n = 3). *p<0.05 vs. untreated cells.

