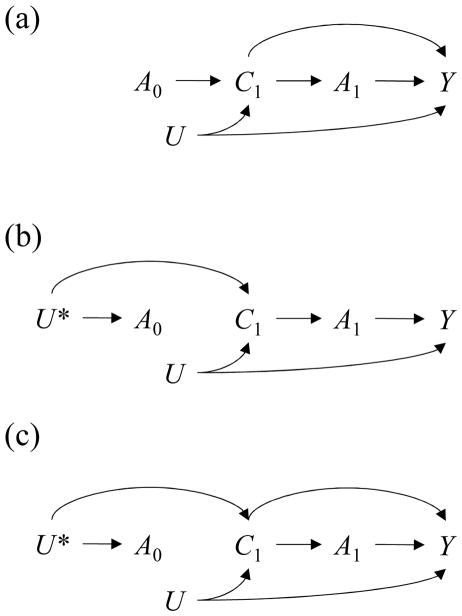
Figure 3.
Causal Directed Acyclic Graphs describing a hypothetical study with exposures A(t), measured covariates C(t), and unmeasured variables U* and U, and also outcome Y. Each scenario represents a different structure of bias due to exposure-covariate feedback. In scenario (a) stratifying on C(1) will block the effect of A(0) and Y and open the non-causal path
 . In scenarios (b) and (c) stratifying on C(1) opens the non-causal pathway
 . In all scenarios, adjusting for C(1) by stratification leads to bias. Adjusting by a g-method e.g. removing the arrow from C(1) to A(1) does not induce bias. Note that in (c) there is unmeasured confounding by U* from the path A(0) ← U* → C(1) → Y and g-methods will not remove it. Because Diagnostic 2 would pick up this unmeasured confounding as an imbalance e.g. A(0) ← U* → C(1), it is most interpretable when investigators are diagnosing covariate history sufficient enough to support exchangeability assumptions (i.e. no unmeasured confounding).

