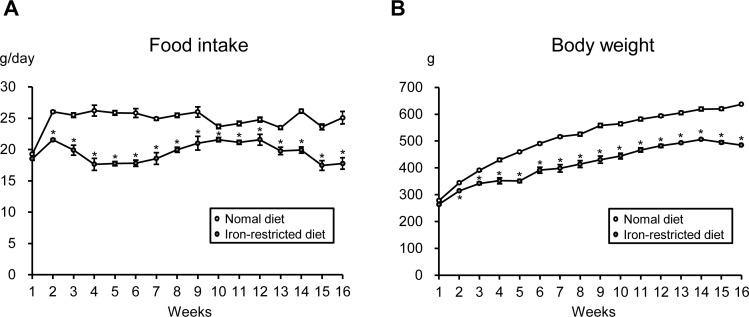
Fig 1. Comparison of Food Intake and Body Weight between SD Rats Given a Normal Diet or an Iron-restricted Diet.
Time course of (A) the amount of food intake and (B) body weight in an ad libitum normal diet (white circle) and iron-restricted diet (gray circle) groups (n = 6 in each group). *p < 0.05 versus the normal diet group.

