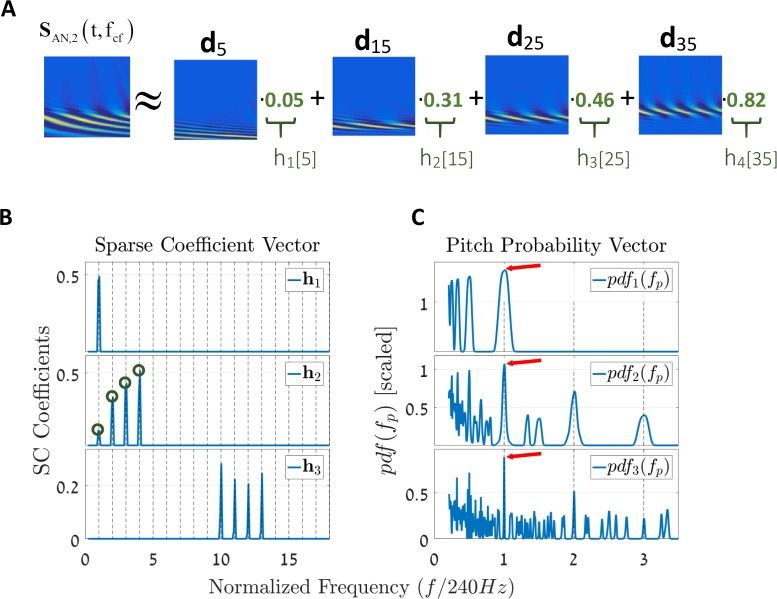
Fig 4. The sparse coefficient vector h and the final pitch probability vector.
(A) A simplified view of the SC methodology. The algorithm decomposed the two-dimensional signal SAN,2(t,fCF) into a linear combination of four atoms (columns) within D. This is a simplified view that shows the primary values in h2 (green indices) multiplied by the atoms. (B) The sparse coefficient solution vectors, hk, for the three cases (k ∈ [1,2,3]). The green circles in the figure of h2 correspond to the four terms in the simplified example of (A). All x-axes are normalized by the fundamental frequency f0 = 240 Hz for convenience. Observe that the solutions for hk resemble that of the FT for the respective stimuli (Fig 2A). (C) Using the pitch estimation unit (harmonic sieve), we can easily map the information in hk, for k ∈ [1,2,3], into a pitch probability vector, pdf(fp). Each of the y-axes of the pdfs functions is multiplied by a constant (x100) for visual clearance. The red arrows indicate the locations of the maximum peaks, all of which are shown to occur at the fundamental harmonic. In other words, it is most probable that all three stimuli represent the same pitch. Still, note that other options are also plausible, especially in rational ratios of f0.

