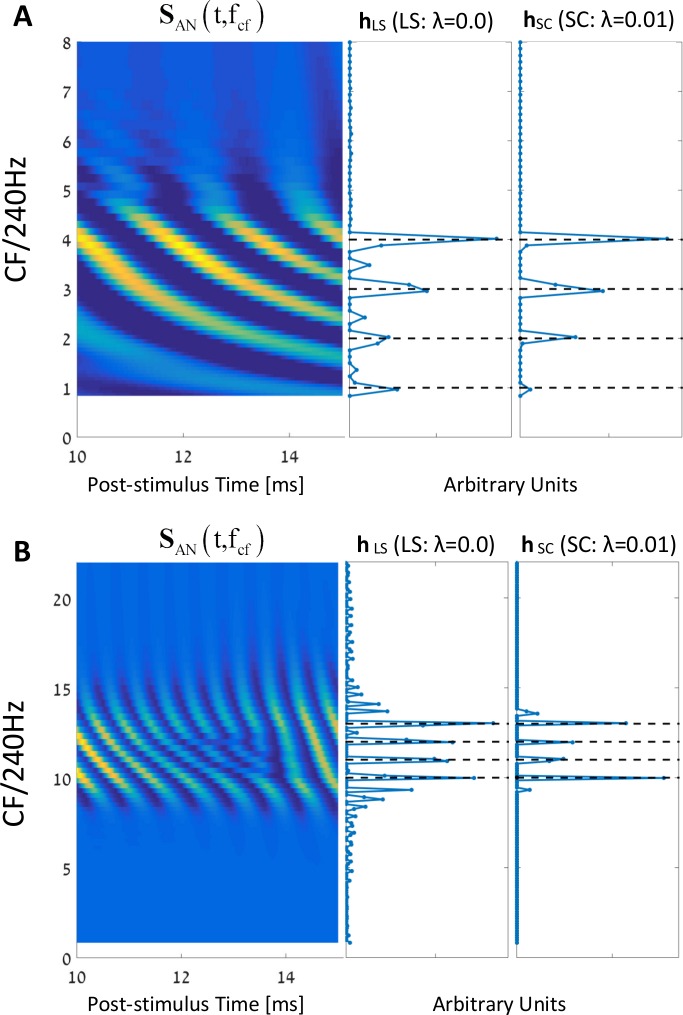
Fig 5. Comparing LS with SC.
(A) From left to right: the AN population response for a harmonic complex with the 1st – 4th harmonics. The y-axis is the CFs normalized by the fundamental frequency, in a linear scale (f0 = 240 Hz). The x-axis indicates the post-stimulus time (between 10ms to 15ms). Next, the h coefficient vectors for the LS case (λ = 0.0) and for the sparse case (λ = 0.01). (B) Same as in (A) but for a complex tone stimulus that contains the harmonics 10th–13th. Note that for the lower harmonic stimulus (A), the results between the two cases, i.e., hLS vs. hSC, are almost identical. On the other hand, for the stimuli with the higher harmonics (B), the difference is more substantial. Specifically, there are much more nonzero coefficients in hLS than in hSC that are unrelated to the original spectrum structure of the signal (compare with the FTs in Fig 2A).

