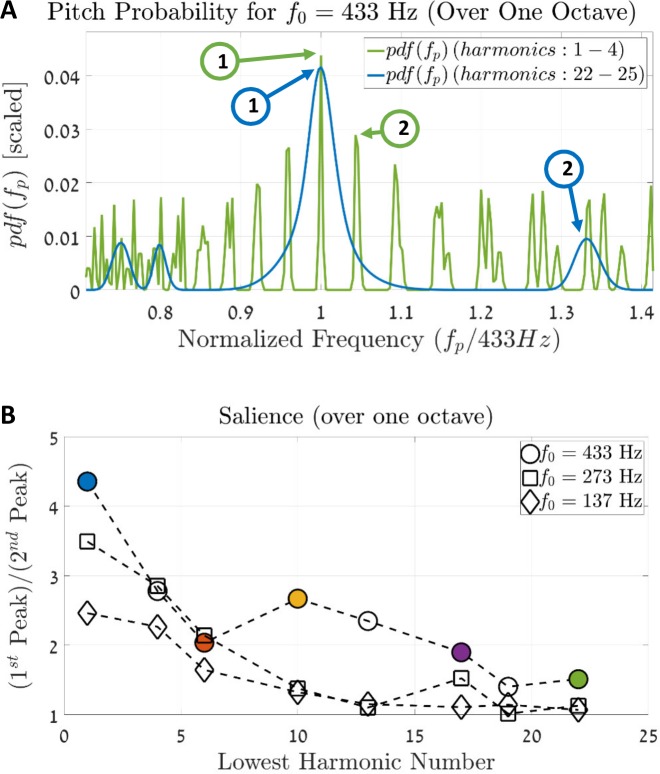
Fig 10. Salience of complex tones.
(A) A Comparison between the two probability functions of the complex tones from Fig 9: the blue line is the pdf of the complex harmonic tone with the 1–4 harmonics, and the green line is the pdf of the fifth stimulus, which comprises 22–25 harmonics. The x-axis is limited to one octave in order to compare the pitch's relative heights and without considering the octave equivalence of consecutive harmonics. The blue and green arrows show the 1st and the 2nd largest peaks of the two curves, respectively. Computing the ratio for each curve between the 1st and the 2nd peaks yields a measure of the pitch's salience; a larger ratio indicates a more prominent percept of tha pitch. (B) Calculating the ratio between the 1st and 2nd peaks for harmonic tones with four consecutive tones at different harmonic numbers. The x-axis indicates the location of the first harmonic in each stimulus, and the y-axis shows the ratio between the 1st and the 2nd peaks (as demonstrated in (A)). Colored circles indicate the relevant stimuli that are shown in Fig 9.

