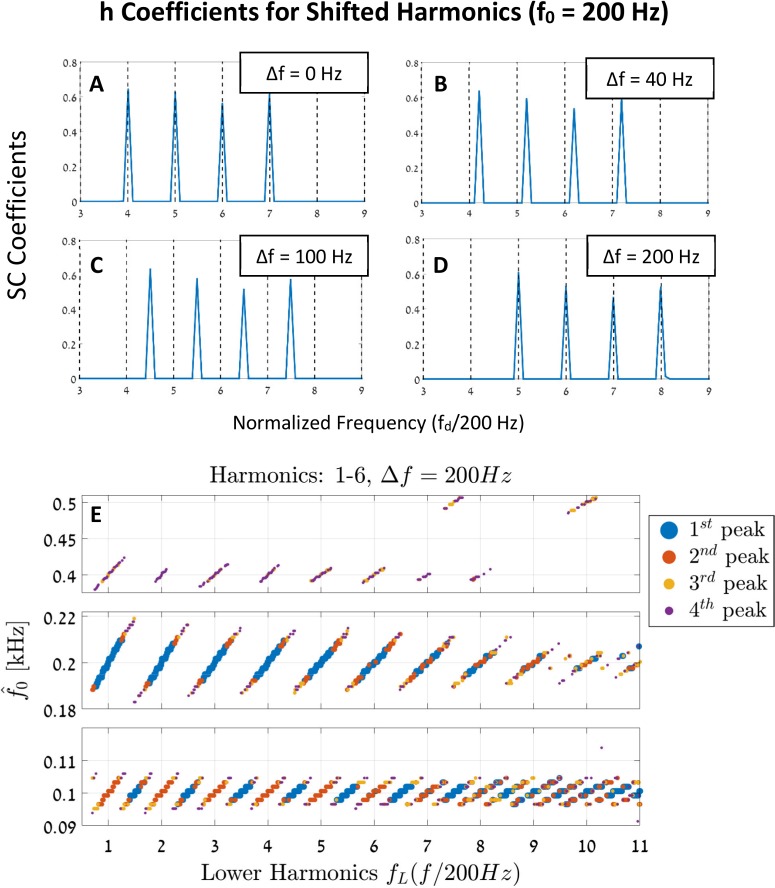
Fig 11. Pitch shift of equally spaced harmonics.
(A-D) The vectors h for complex harmonic stimuli that contain the four harmonics of 4–7 (Eq 8). The x-axis denotes fd normalized by the fundamental frequency, f0 = 200Hz. The four figures show the stimulus in Eq 8 for the cases of Δf = 0 Hz, 40 Hz, 100 Hz, and 200 Hz, respectively. The zero shift case represents a regular complex harmonic signal. The 40 Hz shift is no longer a complex tone of 200 Hz. The third option (C) is a harmonic complex of 100 Hz (with the harmonics 9, 11, 13, and 15). Finally, the Δf = 200 Hz shift results again in a complex harmonics of f0 = 200 Hz but this time with the 5–8 harmonics. (E) The peaks of the probability functions, pdf(fp), for 500 uniformly shifted stimuli. Each stimulus is given by Eq 8, i.e., each signal includes the first four terms (1–4) of the fundamental f0 = 200Hz, plus an incremental frequency shift of Δf. The x-axis denotes the frequency of the lowest harmonic component of the input stimulus (f0 + Δf) normalized by f0 for visual clarity. The y-axis denotes the estimated pitch. To demonstrate the ambiguity of this process, we included the first four largest peaks of each of the resulted pdfs. We focused the view along the 100 Hz, 200 Hz, and 400 Hz in the y-axis; all other regions are mostly empty. Note the linear shifts in the pitch estimations and the changing of these slopes as a function of Δf [47].

