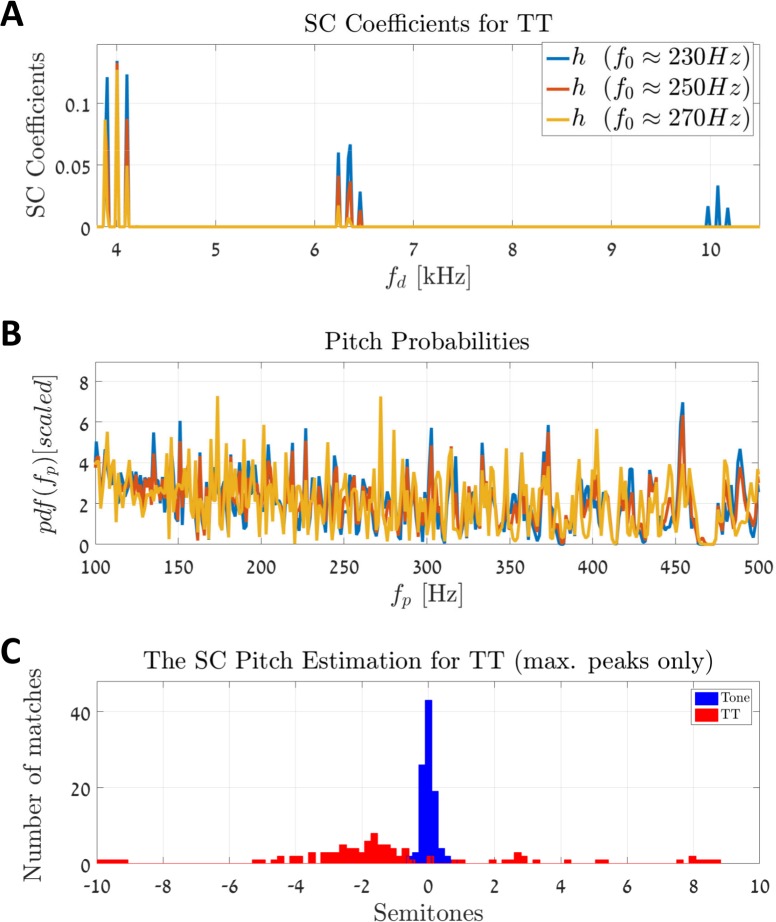
Fig 12. Transposing low-frequency tones into high-frequency regions of the cochlea.
(A) An example of three sparse coefficient vectors, h, for the three frequencies f0 = 229 Hz, 249 Hz, and 269.7 Hz. The resulting h vectors have the same nonzero indices, i.e., these stimuli cannot be differentiated based on their sparse representations. (B) The pdfs of the three TTs are noisy and inconclusive, as expected. (C) Predictions of 100 epochs; only the 1st peak in the pdf is considered. There are two distinct types of stimuli: (i) pure tones (blue), and (ii) TTs (red). Both stimuli are simulated with incremental fundamental frequencies of f0 ∈ [100 Hz, 500 Hz]. Each stimulus is normalized relative to the fundamental f0. The model could estimate the f0 of the pure tones with a high degree of accuracy but could not predict those of the TTs at all (compare with [13]).

