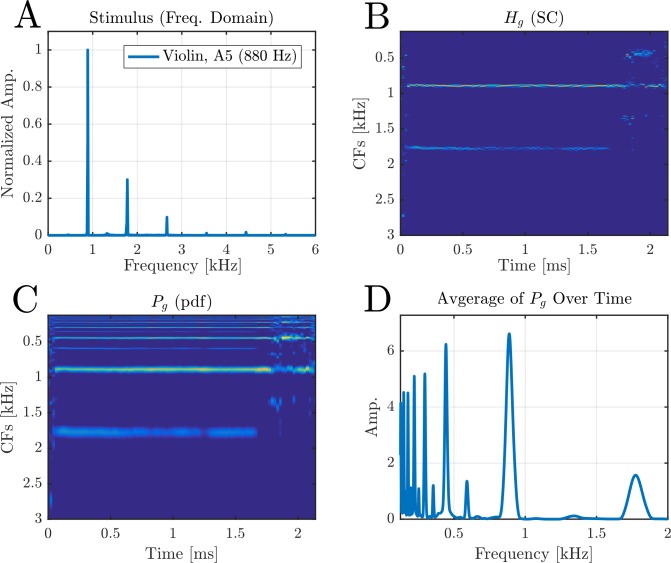
Fig 14. Analyzing a recorded stimulus of a violin.
(A) The Fourier transform of the recorded signal. This is a note of A5 (880 Hz) played by a bow (arco). The 880 Hz and its harmonics are clearly seen. (B) Each time step Tsteps of the stimulus is processed separately. The results are collected to form the columns of the matricx Hg. (C) Each of the SC vectors (columns) of Hg are processed by the harmonic sieve separately to produce the pitch probability of that time step (Pg). (D) To compare between simulations, we average over the time steps to extract the most prominent pitch of the signal. The result is the usual pdf vector, and the estimated pitch is set to the maximum of this pdf.

