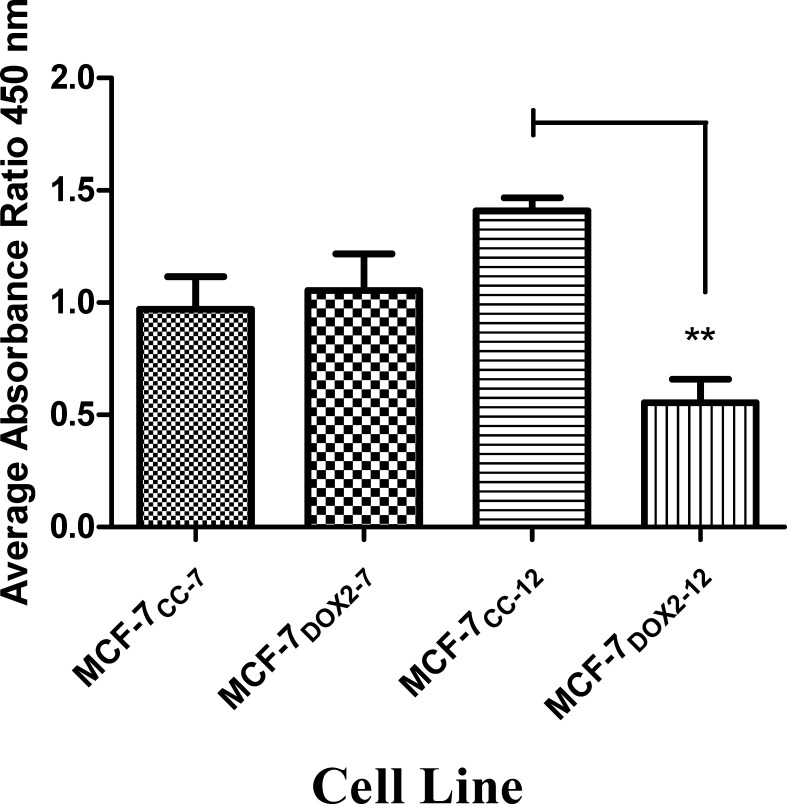
Fig 8. Relative levels of active ERα in nuclear extracts.
Active Era levels were measured in MCF-7CC cells and MCF-7DOX2 cells at selection doses 7 and 12, as determined by ERa TRANS-AM kits. Absorbances were corrected for background and expressed as a ratio (450 nM to 655 nm). Extracts were performed under basal conditions with cells grown in D-MEM to 90% confluence. Values depicted are the mean ± S.E.M. of three independent experiments, each made up of a duplicate technical replicate. The significance of differences in active ERα levels between samples was assessed using an ANOVA test, followed by Bonferoni testing. n = 3, ** p< 0.01

