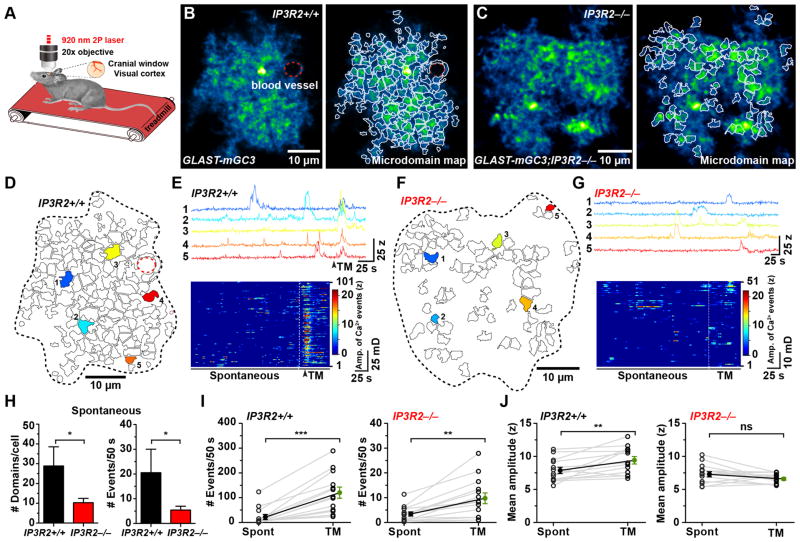
Figure 5. Microdomain Ca2+ transients persist in vivo in IP3R2−/−mice (See also Movie S4, S5).
(A) In vivo two photon imaging configuration in which mice were allowed to walk on a linear treadmill.
(B) Median intensity projection image (pseudocolored) of one astrocyte in vivo from the primary visual cortex (V1) in a GLAST-mGC3;IP3R2+/+ mouse showing active regions during 260 s (left). Map of spontaneously active microdomains is overlaid on image (right). Dashed red line highlights blood vessel.
(C) Image of one astrocyte in vivo from visual cortex (V1) in a GLAST-mGC3;IP3R2−/−mouse, showing median intensity projection (pseudocolored) from 260 s (left). Map of all spontaneously active microdomains (101) that occurred in 286 s is overlaid on image (right).
(D) Map of all microdomains (101) that occurred in 286 s in astrocyte shown in (B) (GLAST-mGC3; IP3R2+/+) mouse.
(E) Intensity versus time plots for five microdomains (corresponding to colors in D) showing characteristics of Ca2+ transients in a GLAST-mGC3;IP3R2+/+ mouse (top). Raster plot displaying the activity of all microdomains (bottom). Timing of enforced locomotion highlighted by dashed line.
(F) Map of all microdomains (51) that occurred in 286 s in astrocyte shown in (C) (GLAST-mGC3;IP3R2−/−) mouse.
(G) Intensity versus time plots for five microdomains (corresponding to colors in F) showing characteristics of Ca2+ transients from cell in (F) (top). Raster plot displaying the activity of all microdomains (bottom). Timing of enforced locomotion highlighted by dashed line.
(H) Histograms of the average number of active microdomains per cell (left) and number of Ca2+ transients (Events) during 50 s of imaging (right), in IP3R2+/+ (GLAST-mGC3;IP3R2+/+) and IP3R2−/−(GLAST-mGC3;IP3R2−/−) mice during baseline activity. Data shown as mean ± SEM. N = 14 cells from GLAST-mGC3;IP3R2+/+ mice and 25 cells from GLAST-mGC3;IP3R2−/−mice were analyzed. ns: not significant, * p > 0.05, unpaired two-tailed Student’s t-test.
(I – J) Graphs showing the number of Ca2+ transients (Events) observed during 50 s of imaging (I) and mean amplitude (z-score) for microdomain Ca2+ transients (J) without stimulation (spontaneous, Spont) and during enforced locomotion on the treadmill (TM) for Control (IP3R2+/+) (left) and IP3R2−/−mice (right). Data shown as mean ± SEM. Note change in scale for the IP3R2−/−mice in (I). N = 13 cells from GLAST-mGC3;IP3R2+/+ mice and 14 cells from GLAST-mGC3;IP3R2−/−mice were analyzed. ns: not significant, p > 0.05, ** p < 0.009, *** p < 0.0001, paired two-tailed Student’s t-test.

