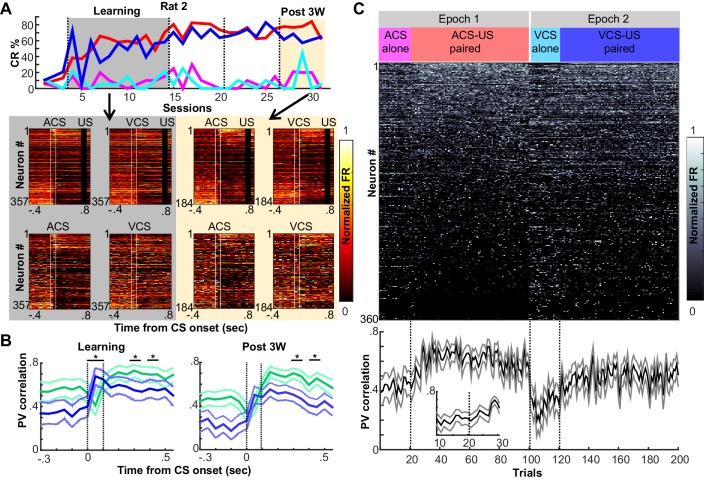
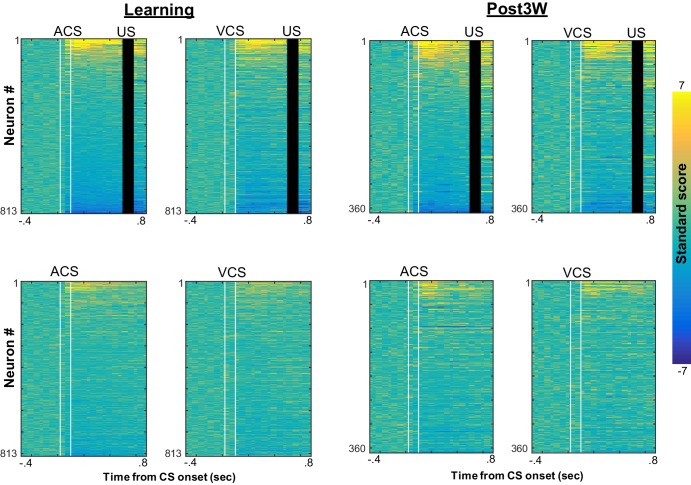
Figure 2. Prefrontal ensemble codes in well-trained rats were selective for relational features.
(A) Example behavior from a single rat. Based on the percentage of trials exhibiting a conditioned response (CR%) and days since asymptotic responding, sessions were divided into five successive stages (vertical lines). Representative pseudocolor plots show normalized firing rate of neurons recorded from the same rat during the learning period (gray) and during the third week after learning (yellow). Top left, ACS-US paired; top right, VCS-US paired; bottom left, ACS alone; bottom right, VCS alone. Neurons were sorted based on the ACS-induced firing rate change during ACS-US pairings from the largest increase (Neuron #1) to the largest decrease (Neuron #357 or 184). During learning, ensemble activity during ACS-US pairings was similar to that during ACS alone presentations and VCS-US pairings; however, during the third post-learning week, it became more similar to that during VCS-US pairings than ACS alone presentations. White lines indicate CS onset and offset, black bars mask US artifacts. (B) During learning (left), binned firing rates of neuron ensembles (PV) during the CS (two vertical lines) were more similar for two conditions with the same modality of CS (ACS-US paired and ACS alone, blue, r ± 95% confidence intervals) than two conditions with the same stimulus relationships (ACS-US paired and VCS-US paired, green). Their similarity became comparable between two condition pairs during subsequent CS-US intervals. During the third post-learning week (right), PV became more similar for two conditions with the shared stimulus relationship than those with the shared CS modality. * indicates p<0.05/10 in random permutation tests. (C) Trial-by-trial display of PVs during CS-US intervals in the third post-learning week. Neurons from four rats were sorted based on the firing rate during ACS-US paired trials from the highest (Neuron #1) to the lowest (Neuron #360)]. A ‘template’ PV was constructed as averaged PVs across 10–80th ACS-US paired trials. The correlation coefficient between the template and PV in each trial (±95% confidence interval) rapidly increased within the first ten ACS-US paired trials (inset). Upon the transition from the epoch with the ACS to the next epoch with the VCS, it abruptly decreased but increased again when the VCS-US pairings began.
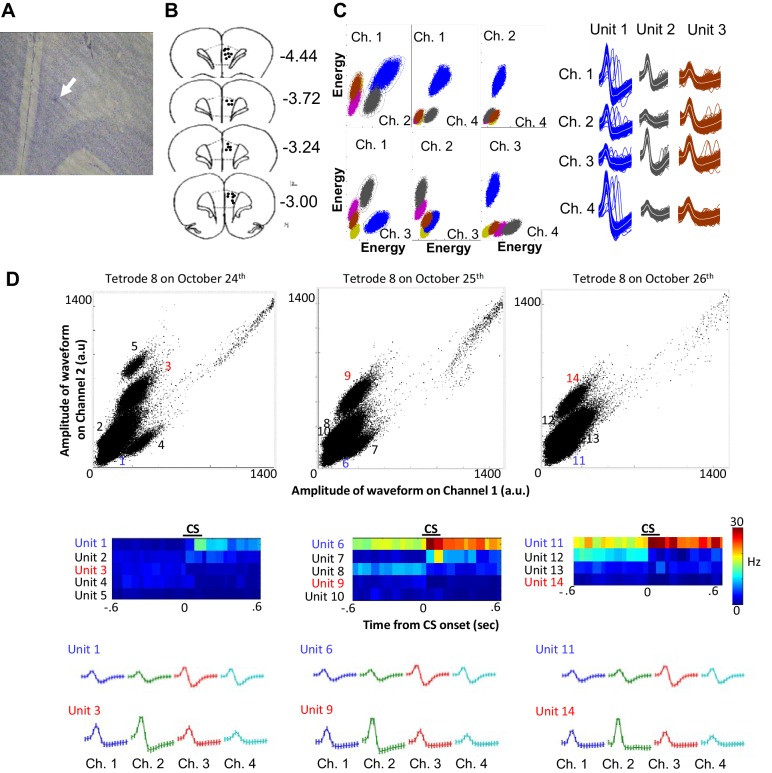
Figure 2—figure supplement 1. Histology and single unit isolation.
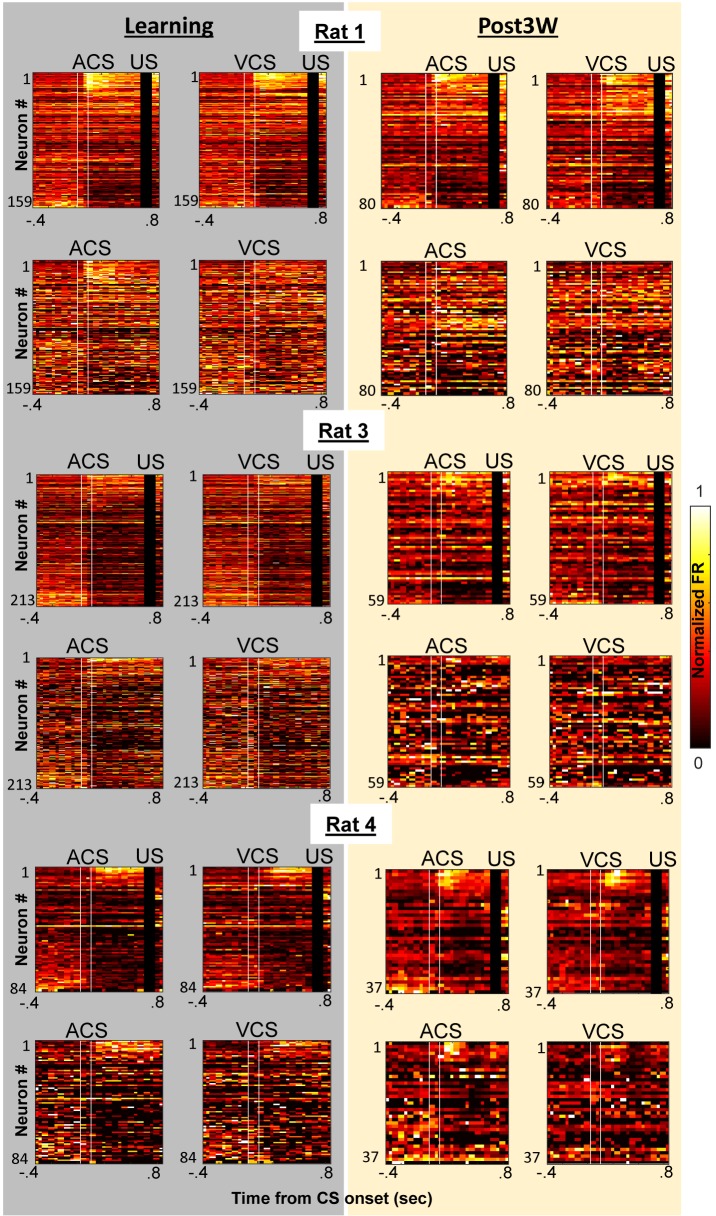
Figure 2—figure supplement 2. Prefrontal ensemble activity during four conditions with different relational and physical stimulus features.
Figure 2—figure supplement 3. CS-evoked firing patterns during four conditions with different relational and physical stimulus features.
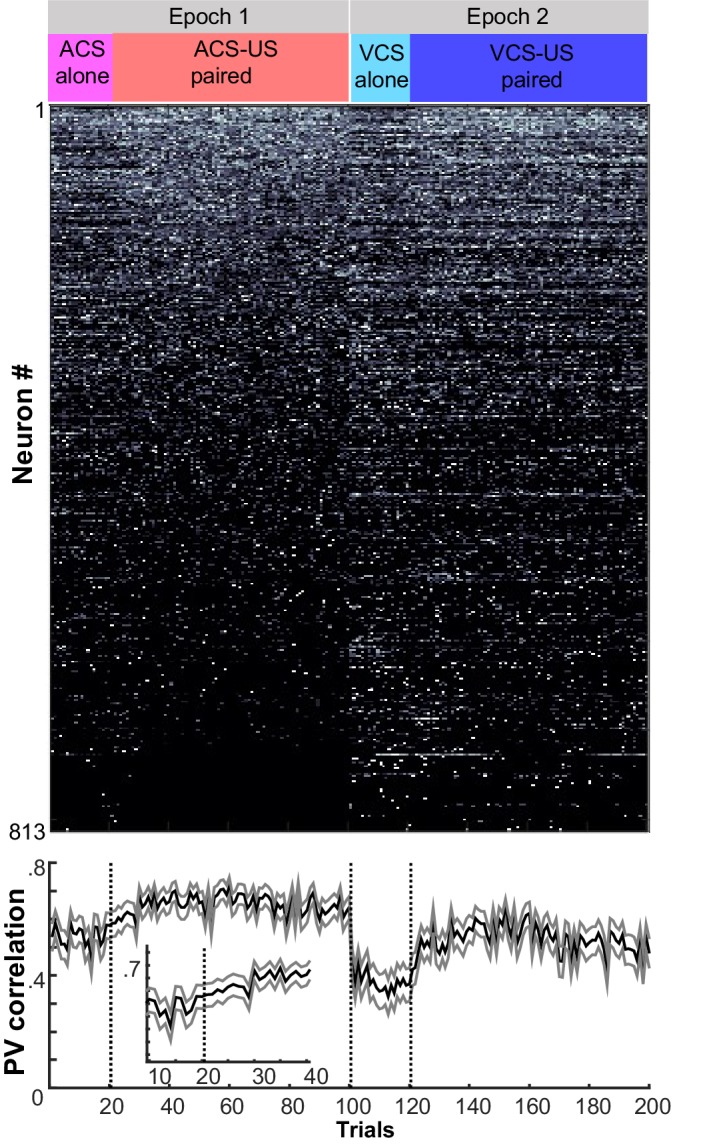
Figure 2—figure supplement 4. Trial-by-trial changes in the similarity of ensemble activity during learning.
