. 2017 Jan 21;6:e22331. doi: 10.7554/eLife.22331

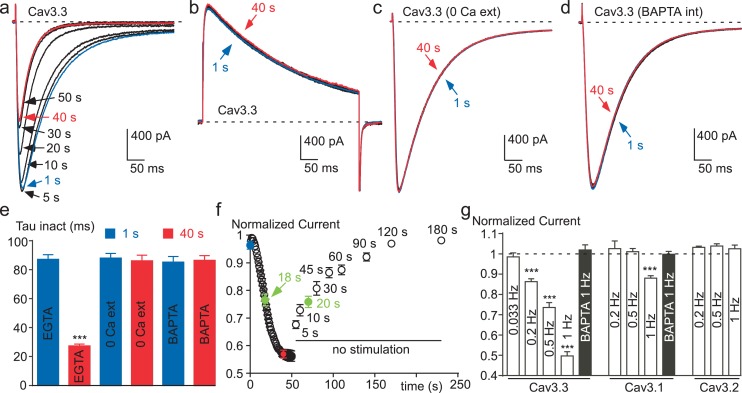
Figure 2. Ca2+ induces a time-dependent inhibition of the Cav3.3 current at high frequency of stimulation.

(a) Typical examples of Cav3.3 currents elicited using a 1 Hz test pulse (TP) stimulation of −30 mV (450 ms duration) from a HP of −100 mV. The traces obtained at the beginning of the stimulation (1 s) and after 40 s stimulation are indicated in blue and red, respectively. (bd) Similar experiments for a TP of +100 mV (b), in the absence extracellular Ca2+ (c, TP −30 mV) and in the presence of intracellular BAPTA (d, TP −30 mV). (e) Inactivation kinetics of the Cav3.3 current measured at the beginning (1 s, blue bars) and after 40 s stimulation (red bars, n = 15–28 per bar). (f) Time-course of the Cav3.3 current inhibition during 1 Hz stimulation and time-course of the recovery of the Cav3.3 current as a function of time after stimulation (n = 13–28 per point). The half-time of both inhibition and recovery of the Cav3.3 current are indicated in green. (g) Summary of the data obtained on the three Cav3 currents at different frequencies of TP stimulation (n = 5–40 per bar).

DOI: http://dx.doi.org/10.7554/eLife.22331.004

Figure 2.

Figure 2—figure supplement 1. The effect of free Ca2+ application on the Cav3.3 current recorded in cell-free inside-out patches.

Figure 2—figure supplement 1.

(a) Effect of 10 µM and 100 µM Ca2+-containing solution on the Cav3.3 current recorded during voltage-ramp protocols in the inside-out patch configuration. (b) Time course of the Cav3.3 current during the experiment presented in (a). (c) Scatter plot and average effect of 1 µM, 10 µM and 100 µM Ca2+-containing solution (n = 10–19 per bar).
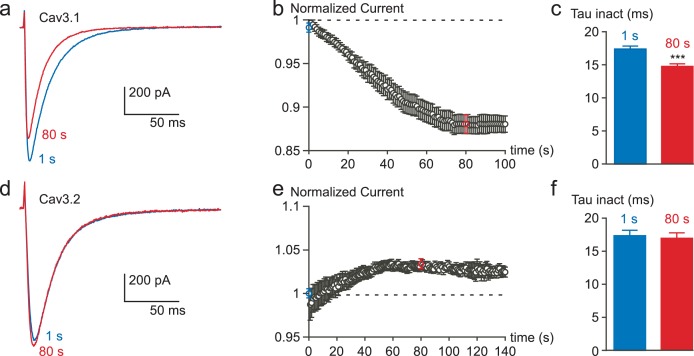
Figure 2—figure supplement 2. Inhibition of the Cav3.1 current at a high frequency of TP stimulation but not of the Cav3.2 current.

Figure 2—figure supplement 2.

Typical examples of Cav3.1 and Cav3.2 currents elicited by a TP stimulation at a frequency of 1 Hz (TP of −30 mV, 180 ms duration) from a HP of −100 mV. (a) Cav3.1 current recorded at the beginning of the stimulation (1 s) and after 80 s stimulation (80 s). (b) Time-course of the Cav3.1 current inhibition during this 1 Hz stimulation protocol (n = 40). (c) Inactivation kinetics of the Cav3.1 current measured at the beginning (1 s) and after 80 s of stimulation (n = 40). (d) Cav3.2 current recorded at the beginning of the stimulation (1 s) and after 80 s stimulation. (e) Time-course of the Cav3.2 current during a 1 Hz stimulation protocol (n = 23). (f) Inactivation kinetics of the Cav3.2 current measured at the beginning (1 s) and after 80 s stimulation (n = 23).