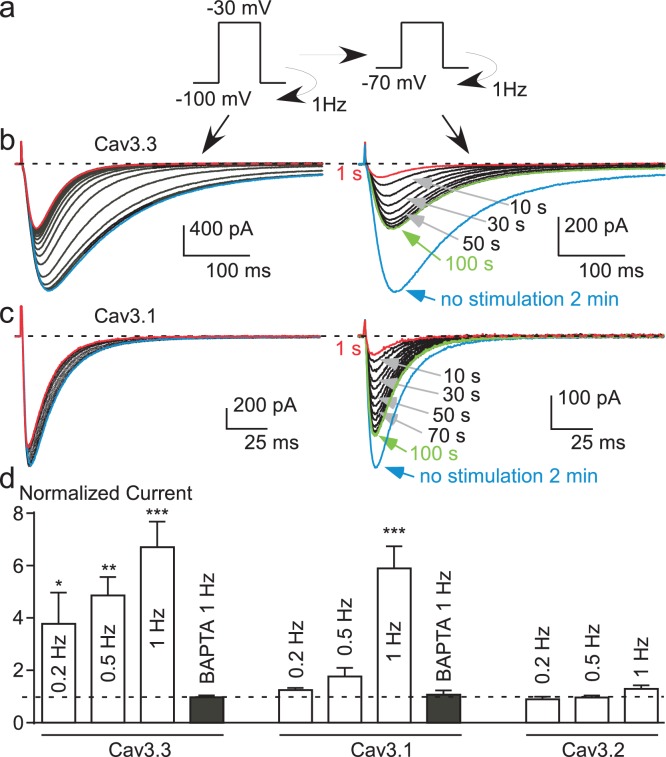
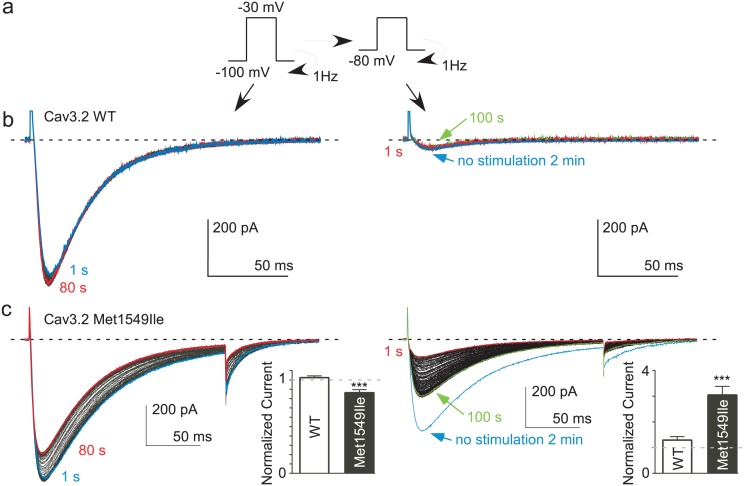
Figure 5. Potent T-type current recovery at physiological resting potentials.
(a–c) Fast TP stimulation (TP −30 mV) using HP of −100 mV to induce inhibition, switched to a HP of −70 mV to induce recovery (see protocol in (a)). The inhibition of Cav3.3 and Cav3.1 currents was measured using fast TP stimulation at a HP of −100 mV (b–c, left panels) whereas the recovery of the Cav3.3 and Cav3.1 currents was measured on a HP of −70 mV (b–c, right panels). (d) Quantification of the increase (recovery) in Cav3.3, Cav3.1 and Cav3.2 currents (at HP −70 mV) as a function of the TP stimulation frequency (n = 5–40 per bar). The normalized current corresponds to the ratio of the current obtained after 2 min without stimulation (blue trace) to the initial current (1 s, red trace) recorded at a HP −70 mV.


