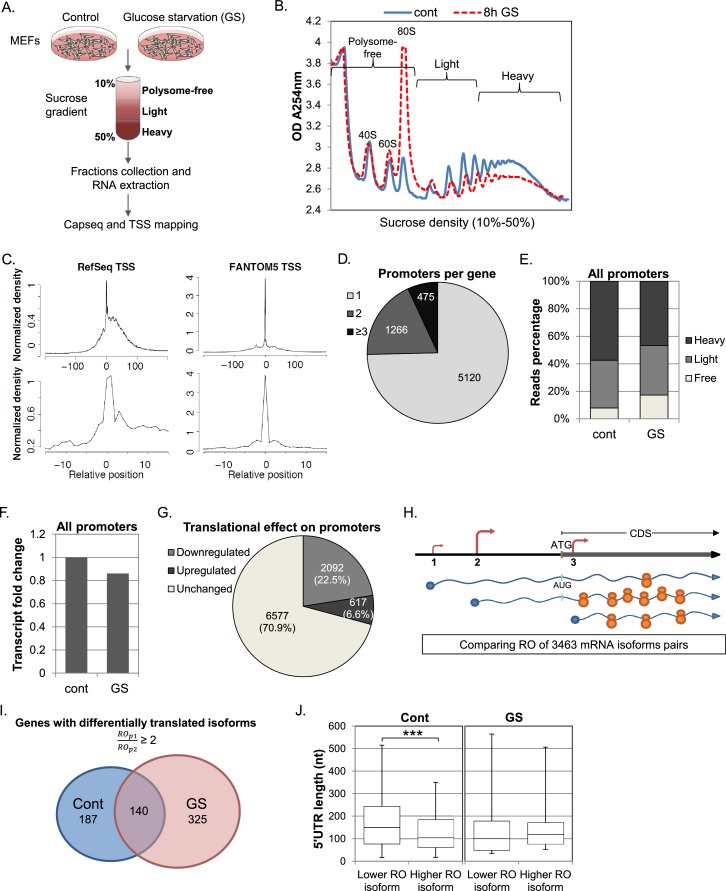
Figure 1. Experimental design and general analysis of the impact of TSS selection on translation efficiency.
(A) A schematic flowchart of the biological experiment and sample preparation for the CapSeq analysis. (B) Polysomal profiling of MEF cells subjected to glucose starvation (GS) for 8 hr (dashed red) or untreated (blue). (C) Metagene analysis of CapSeq reads relative to the annotated TSS of Refseq and the summit of FANTOM5 TSSs at low and high resolutions. Only TSS regions (−200..200) with at least ten bases covered by reads were considered, and the coverage in each region was normalized to mean zero and standard deviation of one. The normalized coverage was then summed across all regions. (D) The relative distribution of genes with the indicated number of promoters per gene. (E) The relative global sum of reads for all promoters (9286 promoters with >500 reads) in the polysome-free, light and heavy polysomal fractions in basal (cont) and GS conditions. The presented data are the mean of two independent replicates. (F) The fold change of the global mRNA levels between the basal (cont) and GS conditions. The presented data are the mean of two independent replicates. (G) The number and percentage of promoters translationally affected by GS. Promoters that had ribosome occupancy (RO) change of two-fold or more in both repeats were considered affected. (H) A scheme demonstrating the differential translation and transcription of transcripts with alternative TSSs/promoters. The TSSs are shown as arrows and the size of the arrow denotes the strength of the TSS relative to other TSSs of the same gene. The number of ribosomes occupying each mRNA represents the extent of its translation. (I) Promoters from the same gene were paired and their ROs were compared. Pairs of promoters that had an RO difference of two-fold or more in control or GS conditions in both repeats, independently, were considered as differentially translated promoters. The numbers of genes with at least one pair of differentially translated isoforms in control and GS conditions in both repeats are presented in a Venn diagram. (J) Boxplot presentation of the distributions of the 5′UTR lengths of differentially translated isoforms in each promoter pair (as presented in I) in control and GS conditions. The bottom and the top whiskers represent 5% and 95% of the distribution, respectively.


