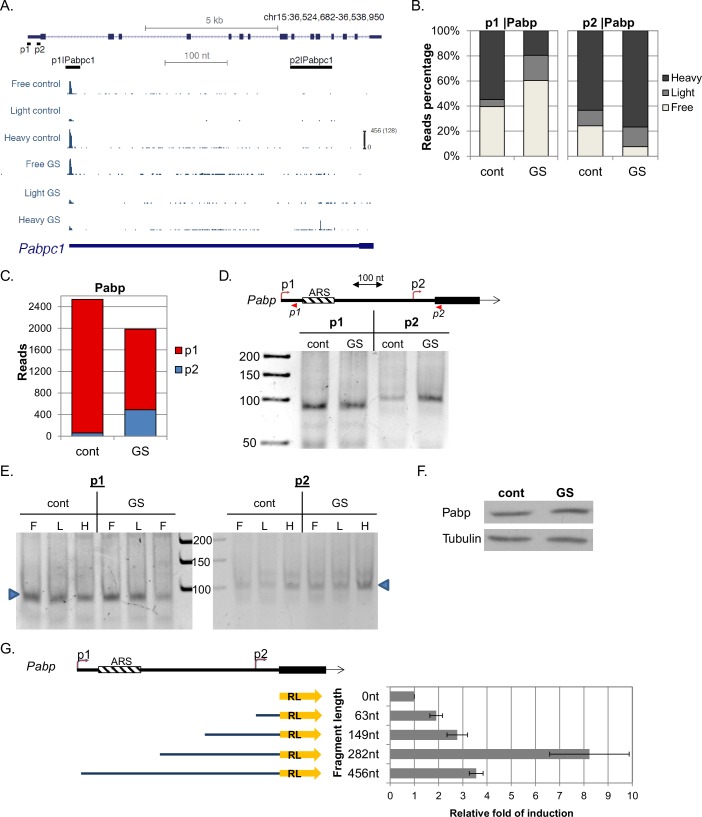
Figure 6. Characterization of Pabp APs.
(A) The chromosomal location, genomic structure and CapSeq data of Pabp in each fraction in basal (cont) and GS conditions. The scale of the normalized and row reads (in parentheses) is shown. The positions of the FANTOM5 promoters are also shown. (B) The relative levels of the indicated promoter reads of the polysomal fractions in control and GS conditions (mean of two independent replicates). (C) The total CapSeq reads of the indicated promoters in control and GS conditions (mean of two independent replicates). (D) 5’RACE analysis of p1 and p2 promoters of Pabp. Upper panel shows a schematic presentation of Pabp region containing the p1 and p2 promoters, their positions, 5’RACE reverse primers (shown as arrowheads) and adenine-rich autoregulatory sequences (ARSs). The lower panel is the analysis of the 5’RACE PCR products by 6% PAGE. (E) Analysis of p1 and p2 transcript isoforms levels by 5’RACE in the indicated fractions of the polysome profile of control and glucose starved cells. (F) Representative immunoblot of total lysate of MEFs with anti-Pabp and anti-Tubulin in control and GS conditions. (G) Characterization of Pabp p2 upstream region as a promoter. A scheme of p2 regulatory sequences of the indicated lengths (starting from the AUG) that were cloned upstream to a promoter-less Renilla luciferase (RL) reporter gene is shown on the left. These constructs were transfected into MEFs together Firefly luciferase reporter gene that served as an internal control. Renilla and Firefly luciferase activities were measured 24 hr after transfection. The results represent average ± SE of 4 transfection experiments.


