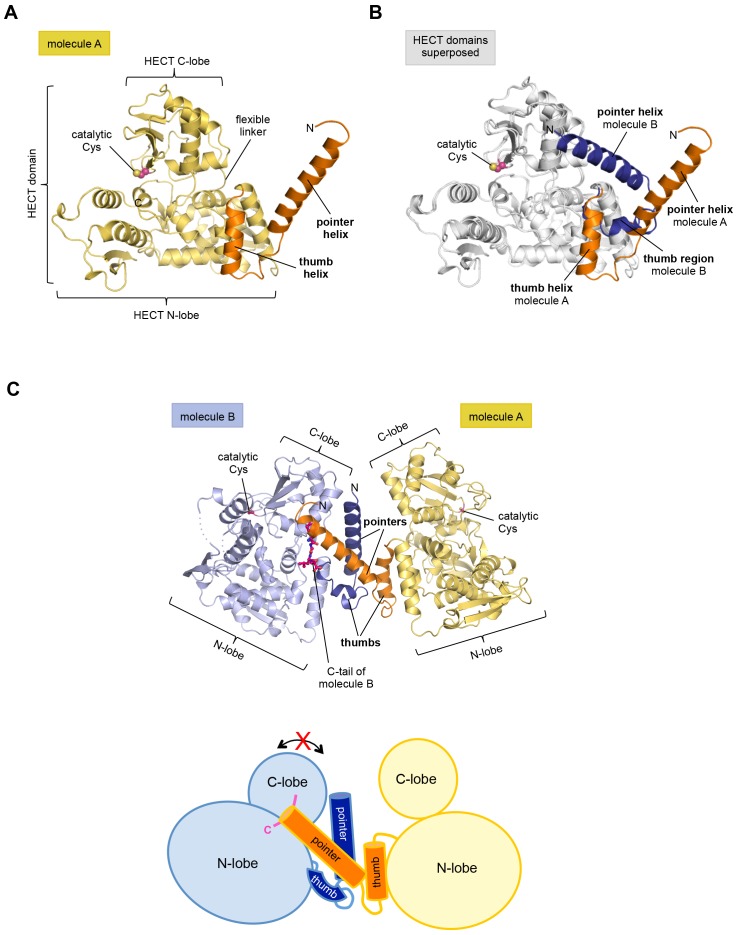
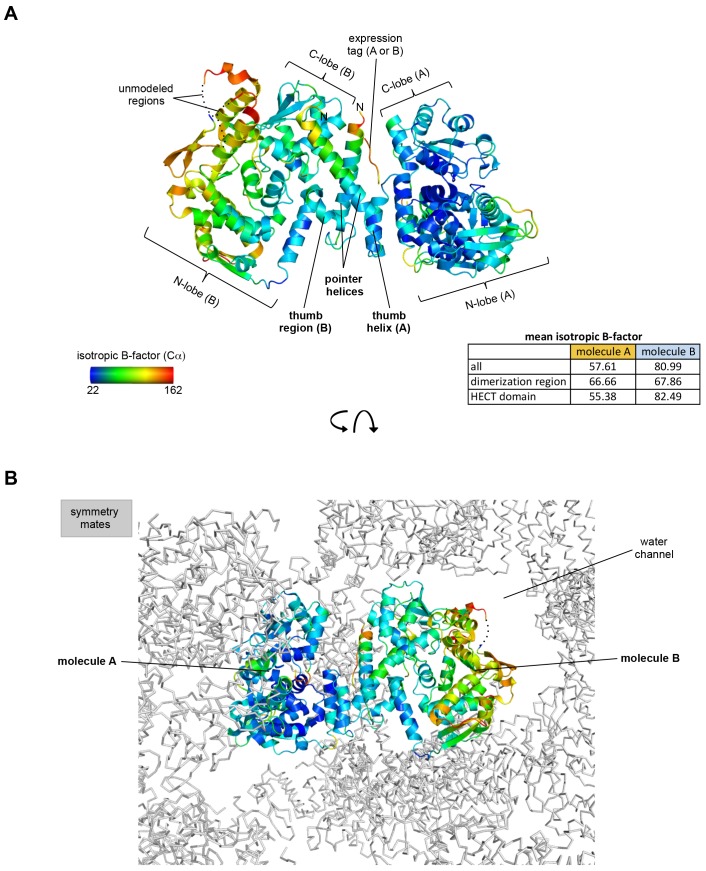
Figure 1. The crystal structure of the C-terminal region of HUWE1 reveals an asymmetric dimer.
(A) Structural organization of HUWE1 (3951–4374), shown for molecule A. The bi-lobal catalytic HECT domain is colored yellow, the previously uncharacterized region orange. (B) Superposition of the HECT domains of molecules A and B (grey). The N-terminal regions are highlighted. (C) Asymmetric dimer formed of molecules A and B in the crystal. The C-terminal residues (4370–4374, ‘C-tail’) of molecule B are highlighted in magenta. Two loop regions in molecule B, distant from the dimer interface, are disordered (dotted lines) (top). Cartoon model of the asymmetric dimer (bottom). The C-lobe and the C-tail (magenta) of molecule B are in a locked conformation (see Figure 2C,D). In all structural figures, the protein backbones are rendered as cartoons and the side chains of relevant residues as ball-and-stick models.


