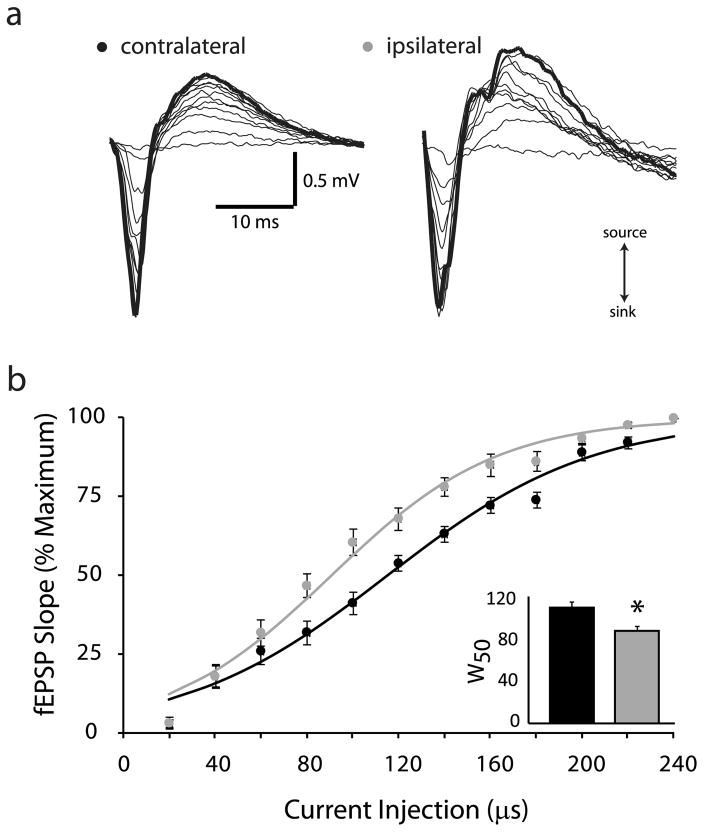
Fig. 2.
Glioma-induced increase in network excitability.
(a) Representative fEPSPs in response to a threshold stimulation intensity and increasing stimulation widths from 20 μs–240 μs in the glioma-injected ipsilateral and contralateral cortices. The slope of the fEPSP was calculated over an area indicated with a grey bar on the rising phase of the fEPSP corresponding to the source (upward slope). (b) The percent maximum fEPSP slope is plotted against the stimulation width to generate input-output curves from the ipsilateral (grey dots) and contralateral (black dots) cortices. The input-output curves were fit with a Boltzmann function which demonstrates a leftward shift in the input-output curve from the ipsilateral cortex (grey line) compared to the contralateral cortex (black line). inset, The half maximum stimulation width (W50), calculated from the Boltzmann fits, was decreased in the ipsilateral cortex (grey bars) compared to the contralateral cortex (black bars). n = 10 slices, 3–4 mice per experimental group. *Denotes a p value <0.05 determined using a Student’s t-test.

