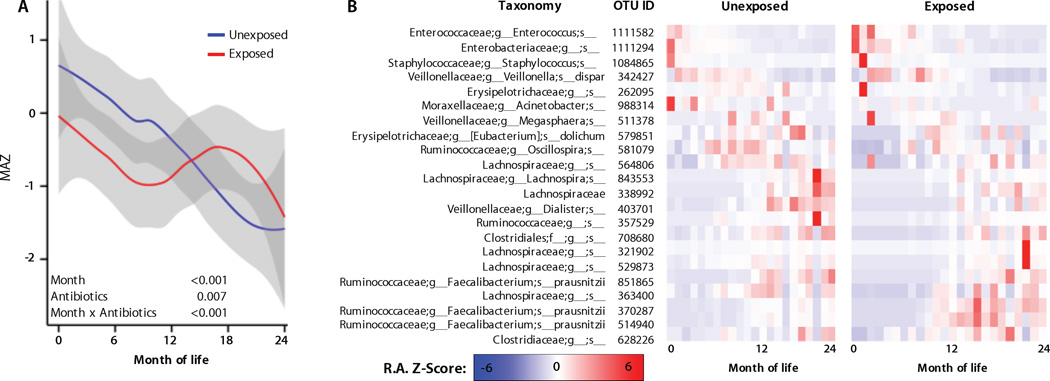
Fig. 4. Antibiotic exposure delays microbiota maturation during early life.
A, Microbiota-by-age Z-scores (MAZ) at each month of life between antibiotic-exposed and unexposed infants (infants never exposed to systemic pharmacologic antibiotic doses prior to the sampling time). MAZ scores indicate the number of standard deviations from the mean predicted age of age-matched control samples, as a function of microbiota maturation. Grey margins represent 95% confidence limits. Asterisks and brackets indicate significant (LME P < 0.05) group differences at baseline or rate-of-change differences across age ranges. The “unexposed” group contains both training set samples (from children who were never exposed to pre-, peri-, or post-natal systemic antibiotics; were vaginally delivered; and dominantly breast-fed), and all other samples from children who had not been previously exposed to systemic post-natal antibiotics. B, OTU abundance heat maps illustrate the relative abundance (RA) Z-scores of 22 maturity-marker OTUs in the antibiotic-exposed and unexposed groups throughout life. These OTUs were selected as those that best predict age of life in the control group, and hence can be used as markers of normal maturity. Substantial departures from the normal maturation profile alter predicted age of other samples. The color scale represents relative abundance (RA) Z-scores for each OTU, (i.e., the number of standard deviations from the mean RA of that OTU) across all samples at that age.

