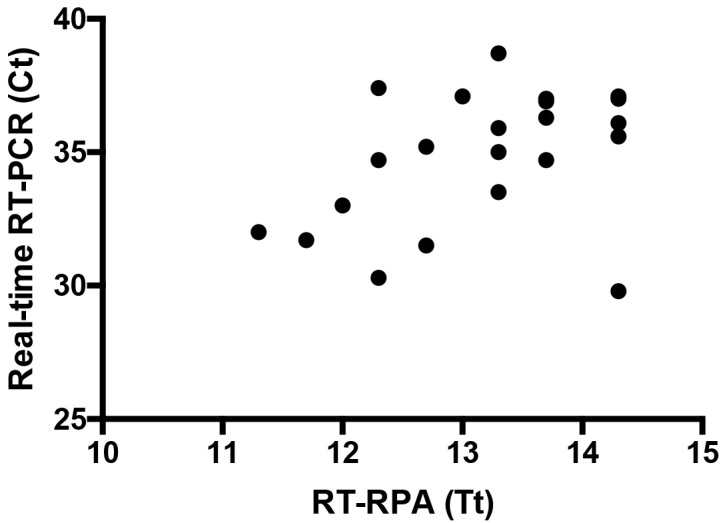
Results of screening 25 urine samples with both real-time RT-PCR and RT-RPA assays.

Twenty samples are shown as three samples produced identical results and two were negative in RT-RPA assay. Linear regression analysis of real-time RT-PCR cycle threshold values (Ct, Y-axis) and RT-RPA threshold time in minutes (TT, X-axis) were determined by PRISM. No correlation was found between TT and Ct values (R2 = 0.17) since the RT-RPA is much faster than the real-time RT-PCR even with samples with high Ct value.
