
Figure 4.
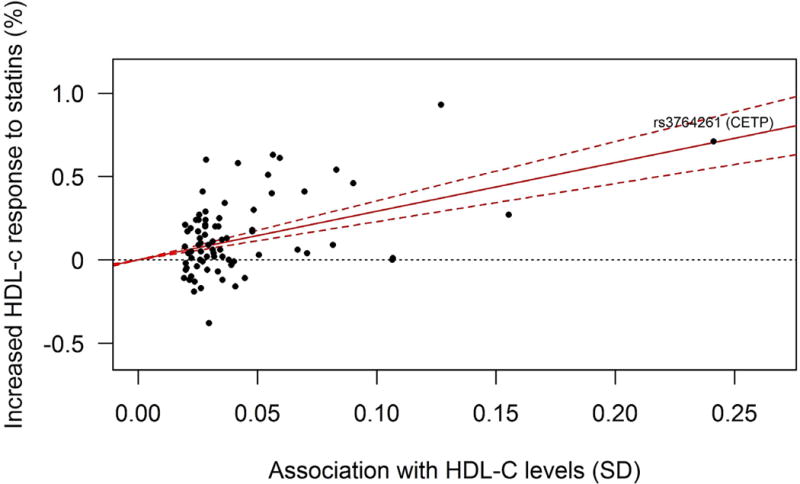
Plot of the per-allele association of genetic variants with HDL-C levels (x-axis, per allele in SD units, as reported by Willer et al. [11]) against the association with HDL-C response to statin treatment (y-axis, percentage) (generated using [22]). The regression line shows the linear relationship between these two variables, with 95% confidence boundaries.