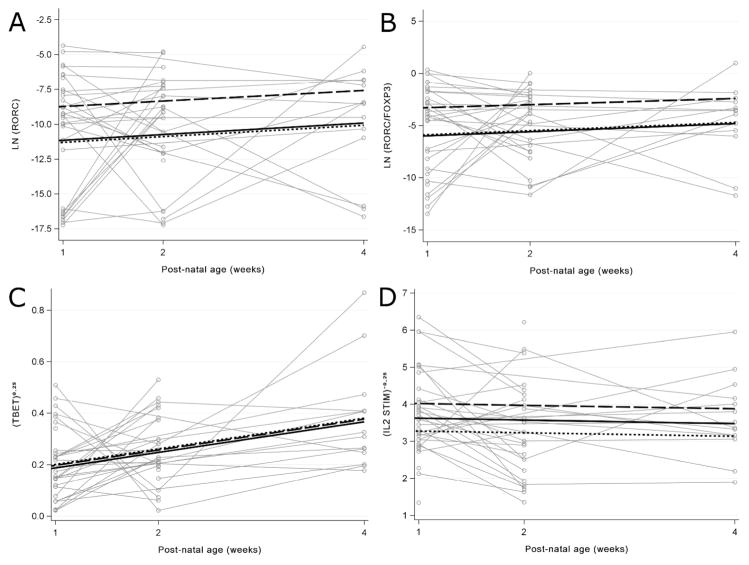
Figure 4. Changes in gene expression levels of immune targets over infant age for the first 4 weeks of life in preterm infants with chorio, funisitis, or BPD using Generalized Estimating Equations (GEE) models.
Changes in relative gene expression were determined for A) natural logarithm of RORC (beta=2.50, p=0.04) and B) the natural logarithm of the RORC/FOXP3 ratio (beta=2.51, p=0.001) in no chorio (n=17) (dotted line), maternal chorio (n=9) (solid line) and funisitis (n=9) (long dashed line) groups. Changes in relative gene expression were determined for C) transformed TBET (mild BPD, beta for transformed (TBET)0.25=−0.004, p=0.09; severe BPD, beta for transformed (TBET)0.25=−0.01, p=0.73 and D) transformed stimulated IL-2 (beta for transformed IL-2−0.25=0.62, p=0.04 in no BPD (n=16) (dotted line), mild BPD (n=13) (long dashed line) and severe BPD (n=6) (solid line).

