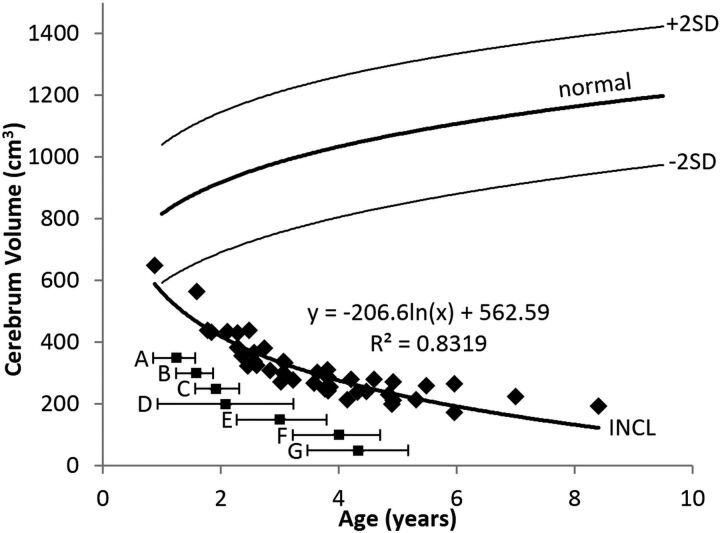
Fig 5.
Cerebrum volume measurements in patients with INCL. Even our earliest measurements of cerebral volumes were lower than normal, and volumes decreased dramatically with time. The equation for the best curve fit is shown. We did not detect a difference between INCL in boys and girls (P = .94). We defined the cerebrum as including the deep nuclei but not the cerebral peduncles. The normal curve reflects cerebrum volumes measured on 23 healthy volunteers 1.1–9.6 years of age participating in other studies at our institution; for the healthy volunteers, we did not find a statistical difference between boys and girls (P = .78) (dark line = mean, light lines = ±2 SDs). For comparison, the onset ages of major symptoms (mean and 95% CI) observed in our patients are plotted below the volume curve. A indicates developmental regression; B, cerebral atrophy noted in clinical MR imaging report; C, myoclonic jerks and seizures; D, loss of vision; E, deceleration of head growth; F, isoelectric visual-evoked potentials; and G, isoelectric EEG or electroretinogram.

