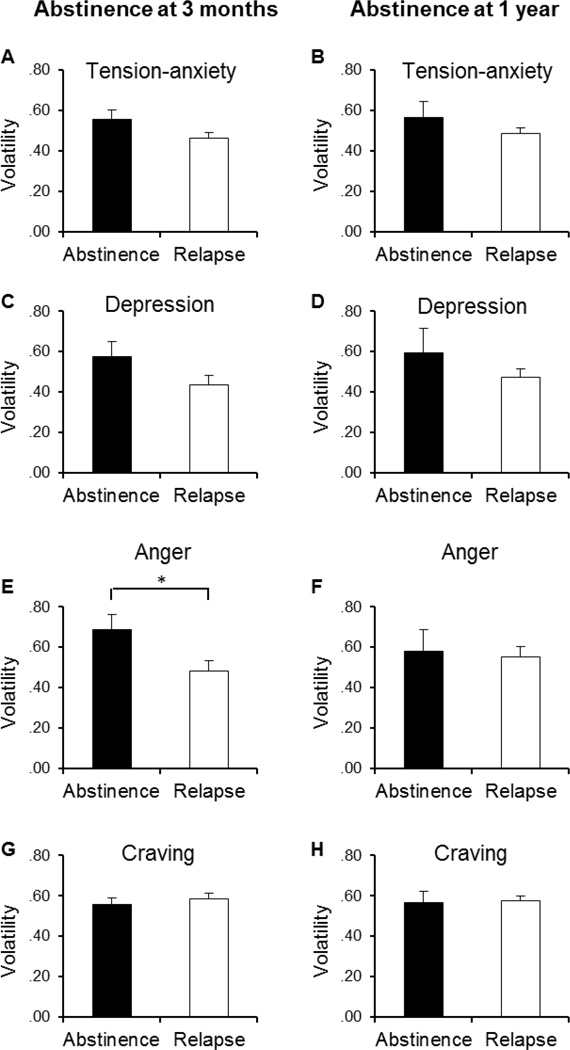
Figure 2.
Volatility of affective symptoms and craving across the initial 44-day tobacco abstinence. The left panels depict the mean volatility of POMS Tension-Anxiety (A), Depression (C), Anger (E), and SWQ Craving scores (G) in the abstainers (N = 52; filled) and relapsers (N = 88; blank) at 3 months postquit. The right panels (B, D, F, & H) show the mean volatility of those measurements in the abstainers (N = 19; filled) and relapsers (N = 121; blank) at 1 year postquit. Group mean for each symptom component was derived from person-specific volatility parameters which were calculated as the root mean square differences between the observed symptom scale scores and the predicted scores from fitted trajectory parameters.*, p < .05 (t-test).

