Figure 3.

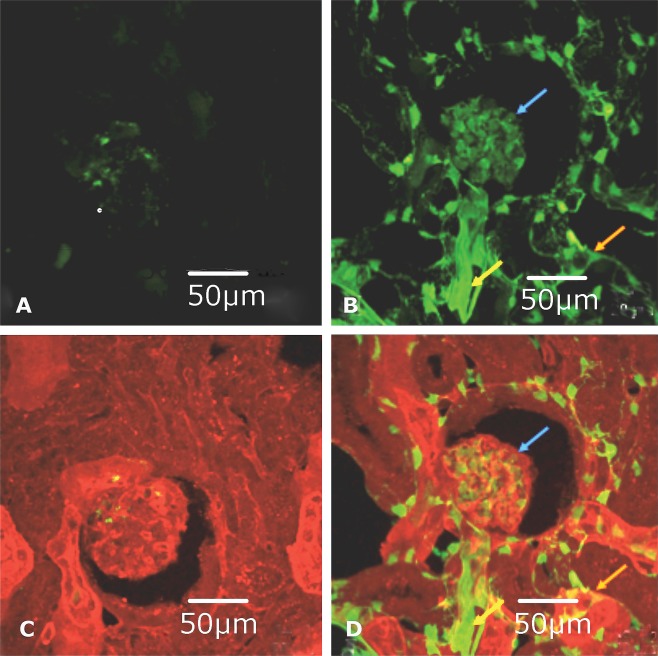
Representative confocal micrographs of FVB and JTMT renal cortex frozen sections immunofluorescently stained for MT and EC. A. FVB: MT expression visualized with FITC (green) immunofluorescence. There was little to no MT expression in tissue sections from the control animal. B. JTMT: MT expression visualized with FITC (green) immunofluorescence. In the transgenic mouse, strong MT staining was observed in the glomerulus (blue arrow), peritubular capillaries (orange arrow) and arterioles (yellow arrow). C. FVB: Merged tomato lectin (red) and MT (green) immunofluorescent staining. The control mouse displayed limited MT expression and it was not associated with the vasculature. D. JTMT: Merged tomato lectin (red) and MT (green) immunofluorescent staining. Due to the somewhat “leakiness” of the TIE‐2 promoter (tends to promote staining of hematopoietic cells) and its ability to bind non‐vascular structures in the kidney, there was limited co‐distribution (yellow staining) of MT with the tomato lectin. However, the MT overexpression was localized to EC in the glomerulus (blue arrow), peritubular capillaries (orange arrow), and arterioles (yellow arrow).
