
Figure 6.
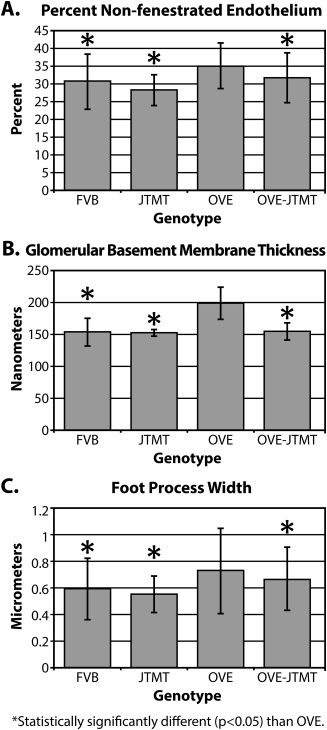
Morphometric differences in components of the GFB in 150 day old FVB, JTMT, OVE and OVE‐JTMT mice. A. Mean percent non‐fenestrated endothelium ± S.D: FVB vs. OVE, JTMT vs. OVE, and OVE‐JTMT vs. OVE all show statistically significant differences. OVE mice show greatest percentage of non‐fenestrated endothelium, while OVE‐JTMT mice exhibited significant protection against non‐fenestration. B. Mean glomerular basement membrane thickness ± S.D: FVB vs. OVE, JTMT vs. OVE, and OVE‐JTMT vs. OVE all show statistically significant differences. OVE mice show the thickest glomerular basement membrane, while OVE‐JTMT mice show complete elimination of basement membrane thickening. C. Mean podocyte foot process width ± S.D: FVB vs. OVE, JTMT vs. OVE, and OVE‐JTMT vs. OVE all show statistically significant differences. OVE mice show the widest foot processes (greatest foot process effacement) while OVE‐JTMT mice show significant protection against increased foot process width.