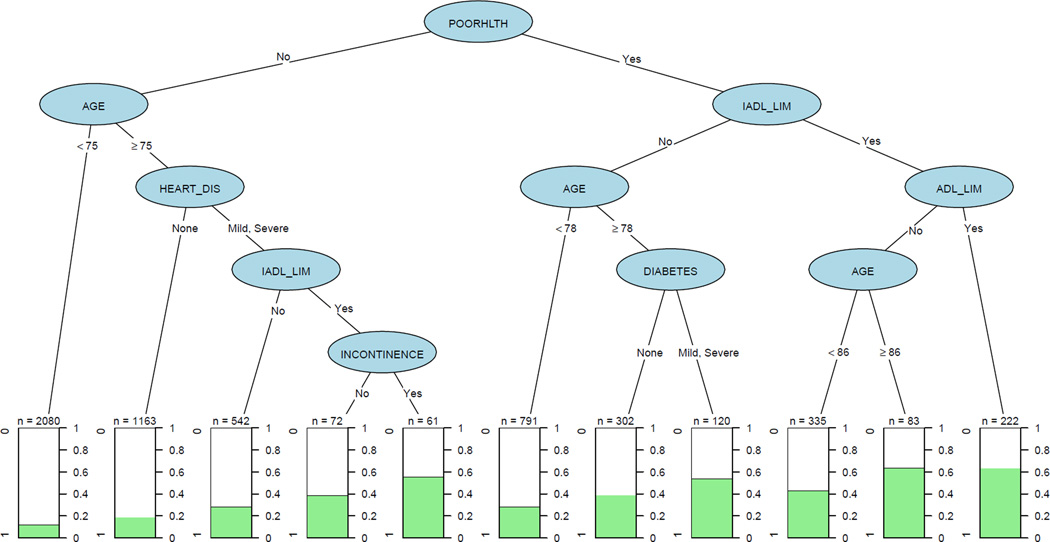
Figure 1. Classification and regression tree analysis of annual Medicare expenditures in top quartile.
Each “path” in the tree concludes with a terminal node that shows the percentage of persons with that combination of characteristics that had high expenditures. For example, there were 222 people with self-rated poor health with IADL limitations and ADL limitations, and 64% of them had high Medicare expenditures. Abbreviations: POORHLTH = self-rated poor health, IADL_LIM and ADL_LIM = (Instrumental) Activities of Daily Living Limitations, HEART_DIS = heart disease.

