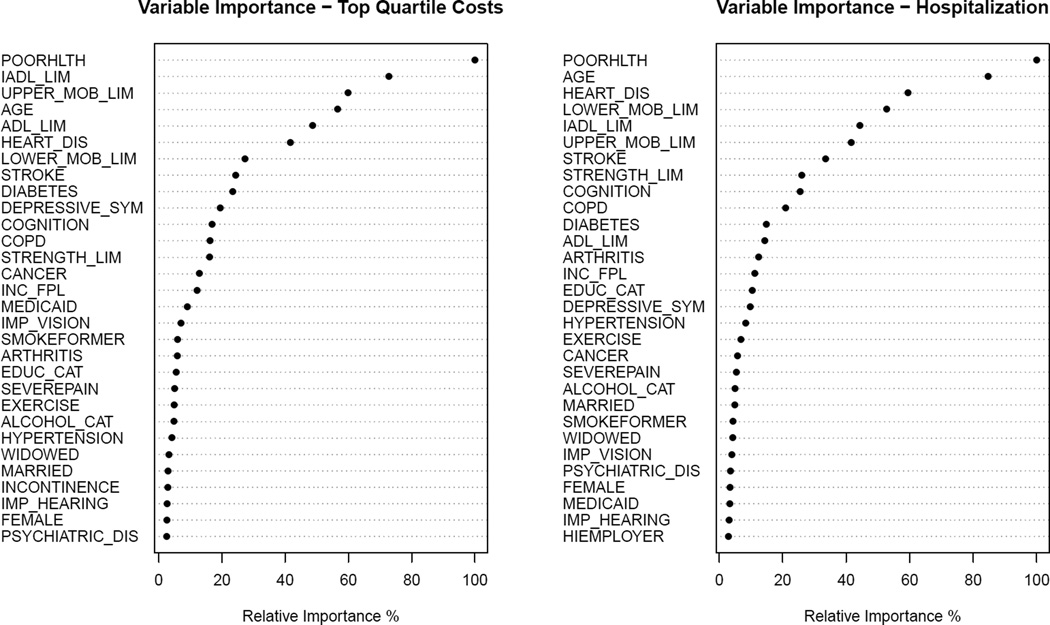
Figure 3. Random Forest Plots.
The plots show the importance of each variable on explaining the outcomes for Medicare expenditures (left) and two-year hospitalization (right) using the Random Forest approach. Higher values indicate that a factor is an important factor associated with the outcome, while low values indicate the factor is not an important factor.

