
Fig. 2.
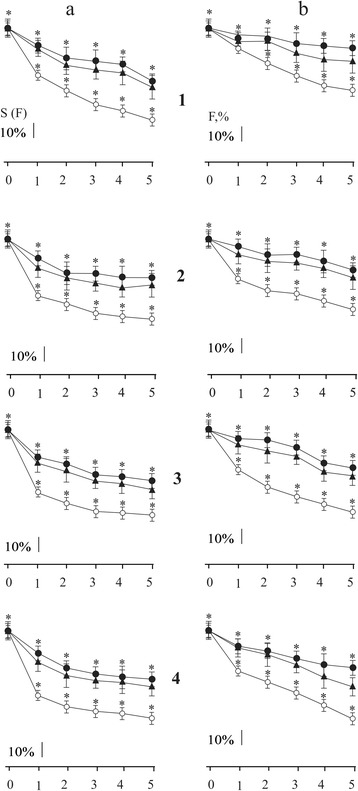
Change of the integrated power S(F) (a) and maximal force of contraction (F) (b) (as a percentage of control values adopted by 100%) of the ischemic soleus muscle at different duration of modulated stimulation: 1, 2, 3, 4 stimulation 2, 3, 4, 5 s, respectively; (○) control (without affecting C60FAS; n = 10); (▲) intravenous administration of C60FAS (dose 1 mg/kg; n = 10); (●) intramuscular administration of C60FAS (dose 1 mg/kg; n = 10). 0, 1, 2, 3, 4, 5 hours after reperfusion muscle. *p < 0.05