
Fig. 3.
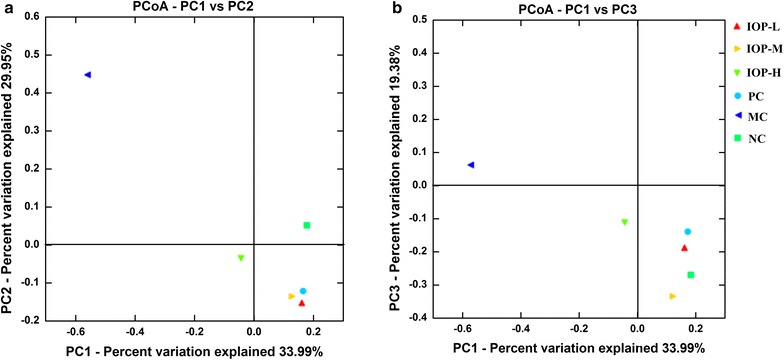
Unweighted principal coordinate analysis plots: Unweighted UniFrac PCoA plotted against PC1 versus PC2 axes (a) and PC1 versus PC3 axes (b). The plots show the clustering pattern among IOP-L, IOP-M, IOP-H, PC, MC and NC groups. MC group is far from the other five groups, and the plots indicate the change of clustering after DDC injection and IOP intake