
Fig. 4.
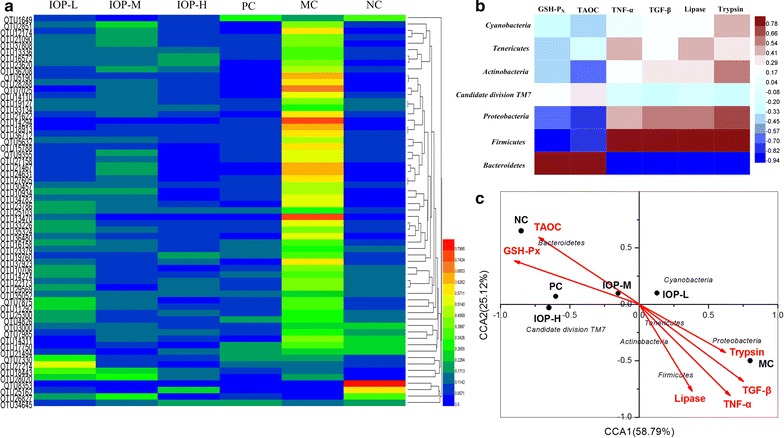
Correlation analysis. a Heatmap of key OTUs in the six groups. b Heatmap of biochemical parameters and gut microbiota at phylum level. c Canonical correspondence analysis (CCA) of six groups
Official websites use .gov
A
.gov website belongs to an official
government organization in the United States.
Secure .gov websites use HTTPS
A lock (
) or https:// means you've safely
connected to the .gov website. Share sensitive
information only on official, secure websites.
Correlation analysis. a Heatmap of key OTUs in the six groups. b Heatmap of biochemical parameters and gut microbiota at phylum level. c Canonical correspondence analysis (CCA) of six groups