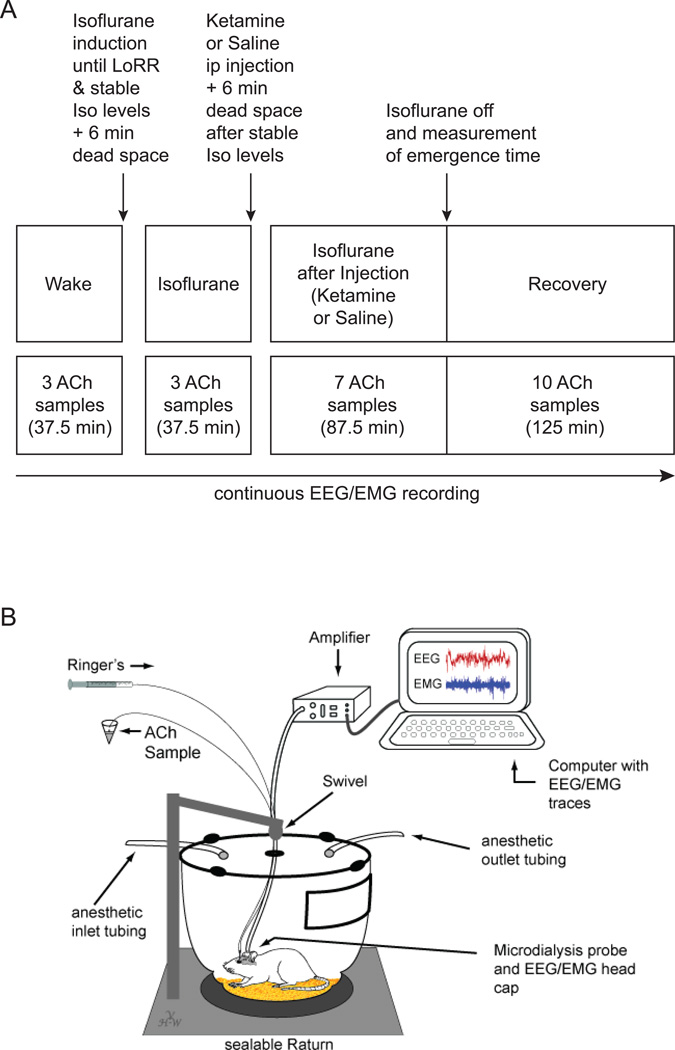
Figure 1. Study design.
A. Schematic time line illustrating the procedure for each animal in this study. Text above the boxes describes the manipulations performed during the experiment. The upper row of boxes describes the different states the animal is in, while the lower row of boxes illustrates the time line and number of ACh samples collected during the different time points. Throughout the entire experiment, electroencephalography (EEG) and electromyography (EMG) were recorded. ACh; Acetylcholine; ip: intraperitoneal; Iso: Isoflurane; LoRR: loss of righting response (surrogate for unconsciousness). B. Schematic shows a modified Raturn in which the animal can freely behave while EEG/EMG data are recorded and microdialysis sampling is performed during various levels of arousal.

