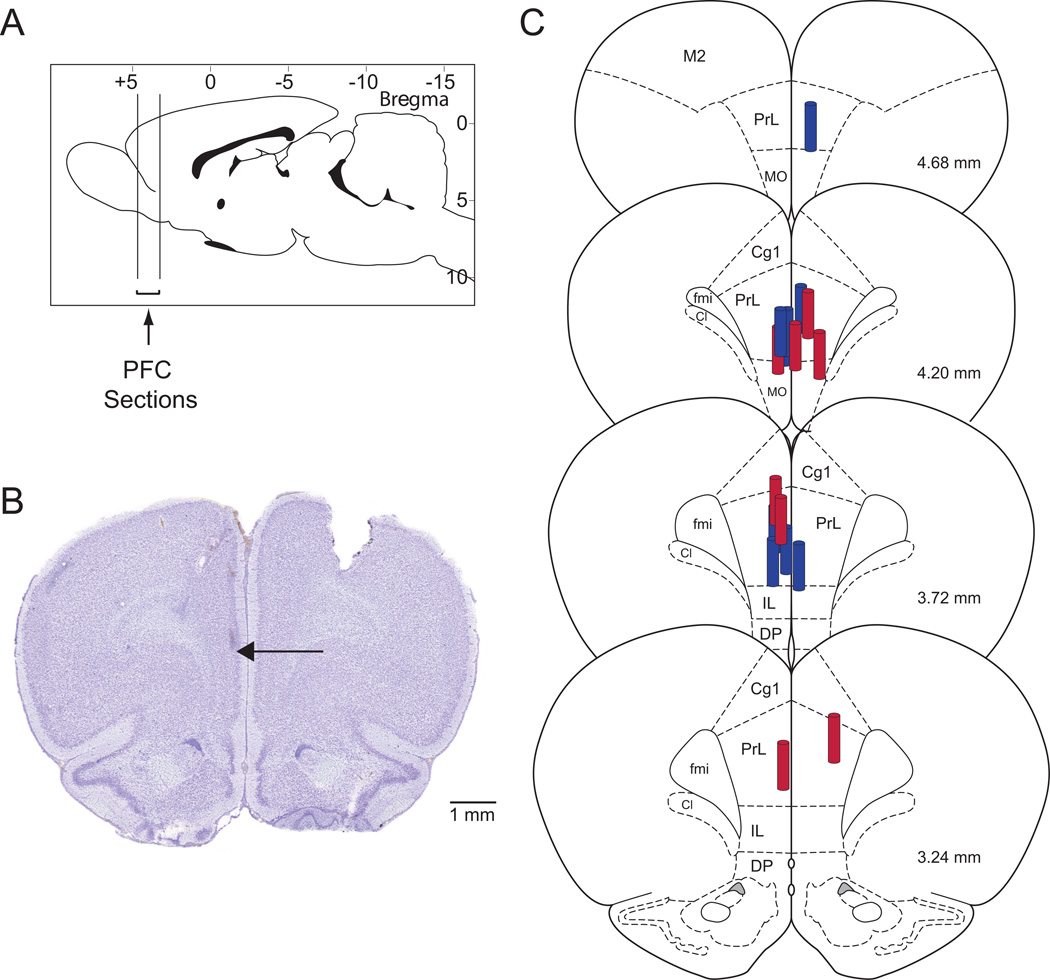
Figure 2. Histologic confirmation of dialysis sites within the prefrontal cortex.
A. Vertical lines on a sagittal diagram of a rat brain25 depict the anterior-to-posterior range of the microdialysis sites within the prefrontal cortex. B. A cresyl violet-stained coronal brain section shows a typical microdialysis site within the prefrontal cortex. The arrow marks the most ventral position of the microdialysis membrane. C. The coronal plates were modified from a rat brain atlas25 to illustrate the location of the microdialysis sites within the prefrontal cortex. The size of the dialysis membrane is indicated by the cylinder drawn to scale, relative to the brain. Microdialysis probes of ketamine treated animals are in red, saline treated animals are in blue. Cg1: cingulate cortex area 1; Cl: caudal interstitial nucleus of the medial longitudinal fasciculus; DP: dorsal peducular cortex; fmi: forceps minor of the corpus callosum; IL: infralimbic cortex; M2: secondary motor cortex; MO: medial orbital cortex; PFC: prefrontal cortex; PrL: prelimbic cortex.

