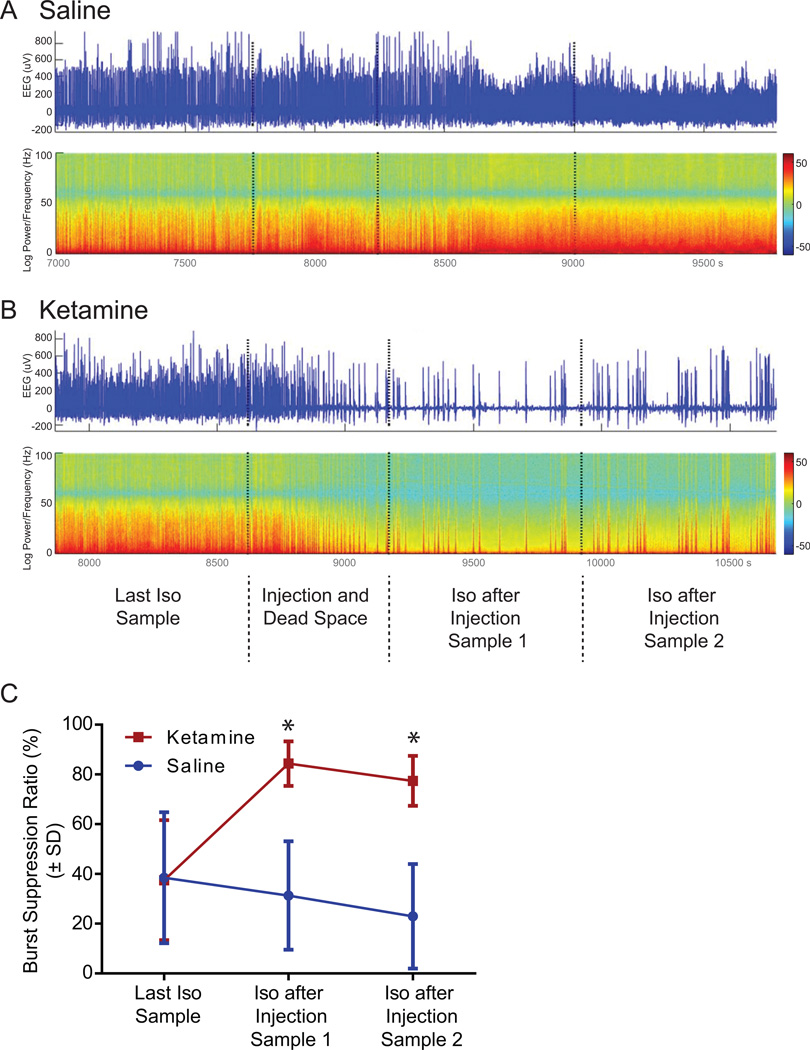
Figure 3. Effect of ketamine injection on electroencephalogram burst suppression ratio.
A and B show representative electroencephalographic (EEG) traces (upper) and power spectrogram (lower) during the transition phase from the last isoflurane-only sample up to the second isoflurane after injection sample for saline (A) and ketamine (B) treated animals. The EEG traces and spectrograms show four different phases divided by the vertical dotted lines. Color bar indicates normalized power in log scale in decibel (dB). C. Rats treated with ketamine showed a significant 125% increase (*) in burst suppression ratio during isoflurane after injection sample 1 and a 107% increase (*) during isoflurane after injection sample 2 when compared to the last isoflurane-only sample in the ketamine group (red data points). In addition, ketamine-treated animals showed a significant enhancement in burst suppression ratio compared to saline treated animals (red versus blue data points). Graph shows data as burst suppression ratio in percent ± SD. Iso: Isoflurane.

