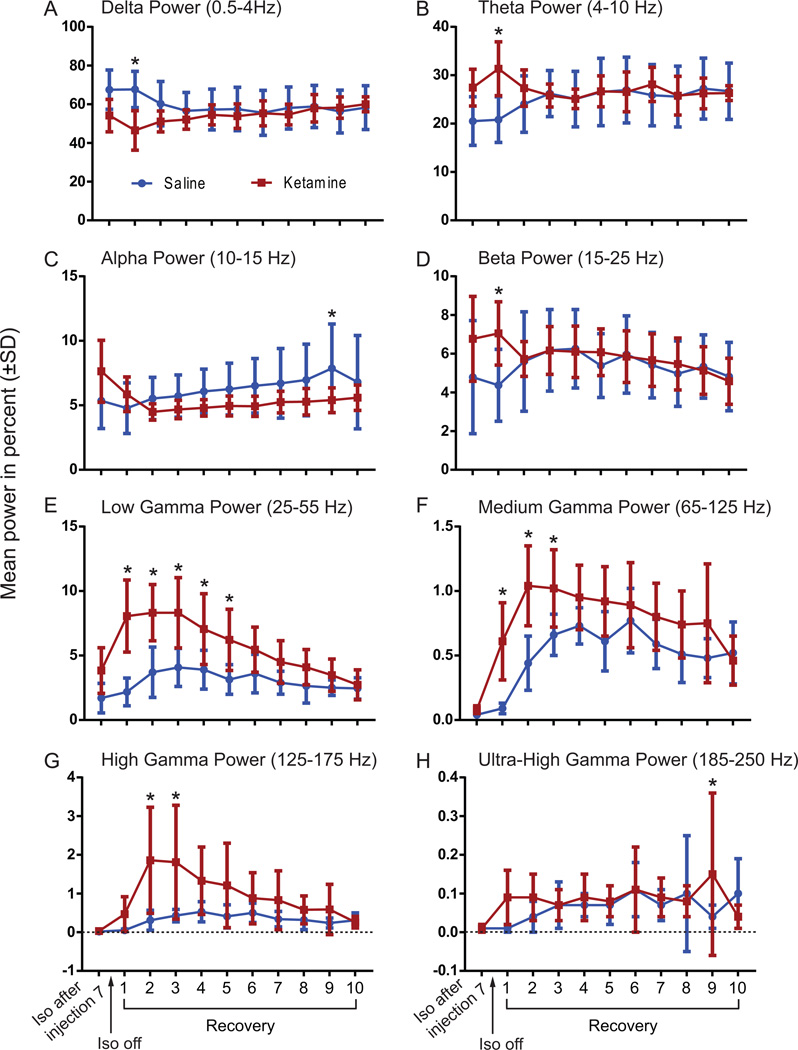
Figure 5.
EEG spectral analysis shows the power for all frequency bands throughout the 10 recovery samples. The averaged power values were calculated for the following frequency bands: A) delta (0.5–4 Hz), B) theta (4–10 Hz), C) alpha (10–15 Hz), D) beta (15–25 Hz), E) low gamma ( 25–55 Hz), F) medium gamma (65–125 Hz), G) high gamma (125–175 Hz), and H) ultra-high gamma (185–250 Hz) with the mean and SD values across all the rats injected with either ketamine or saline. Blue line shows data from saline-treated animals; red line shows data from ketamine-treated animals. Asterisks (*) define statistical significance with p <0.05. Iso: Isoflurane.

