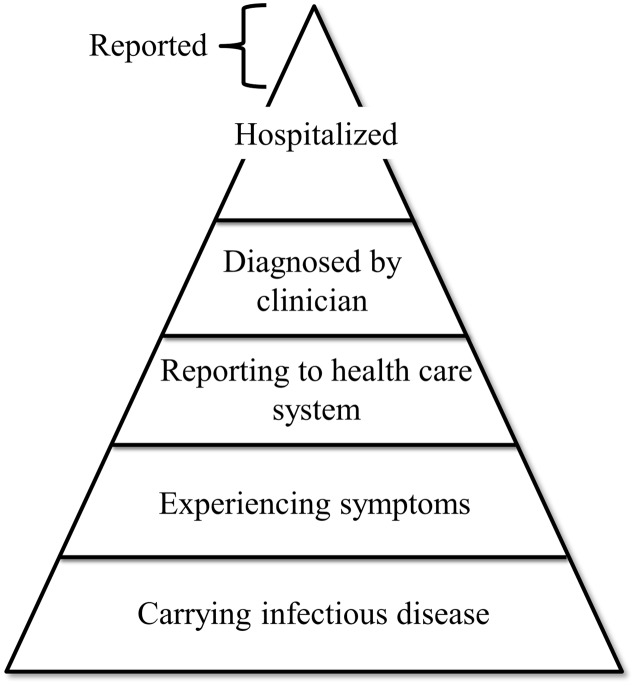
FIGURE 1.
Schematic representation of the phenomenon known as the “surveillance pyramid”. Layers represent different categories of infected individuals. Width of the layers represents the estimated number of individuals in that category. As indicated, individuals reported by surveillance programs generally originate from the hospitalized category.

