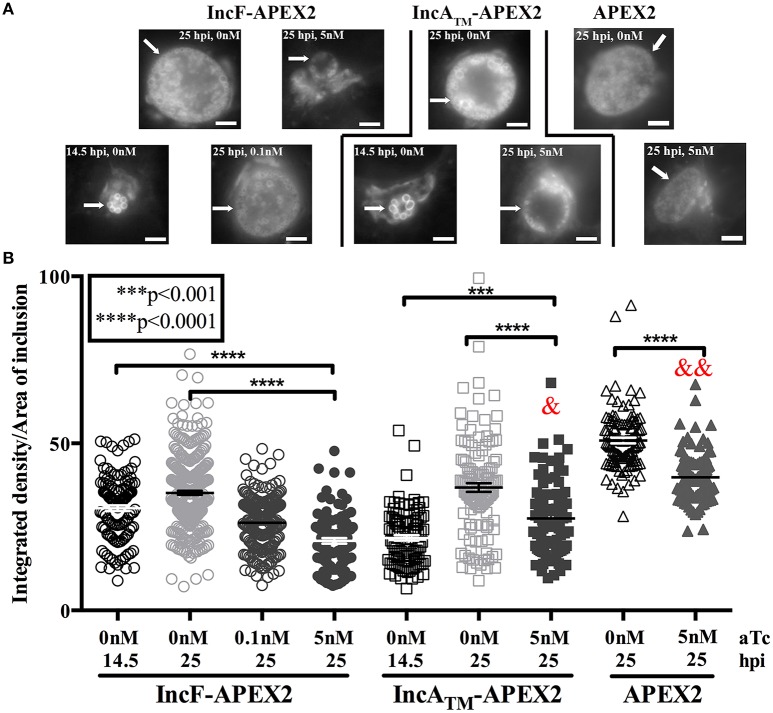
Figure 4.
Effect of Inc-APEX2 expression on acquisition of Golgi-derived sphingomyelin. HeLa cells were infected with Ctr L2 transformants of IncF-APEX2, IncATM-APEX2, and APEX2 only and construct expression was induced 7 h post-infection. Infected monolayers were labeled with NBD-ceramide and back-exchanged to remove fluorescent lipid trafficked to the plasma membrane as described in Materials and Methods. Live cell images were taken at 14.5 or 25 h post-infection using a 60x objective of an Olympus BX60 mounted with a Nikon DS-Qi1MC digital camera. Seven to ten fields of view were taken from duplicate coverslips in two independent experiments, and integrated density (brightness resulting from acquisition of fluorescent sphingomyelin) and inclusion area values were determined using ImageJ v1.48 software (National Institutes of Health, Bethesda, MD). Representative images of the matched graphed conditions are shown in (A). Scale bars are equal to 5 μm, and white arrows indicate inclusions. In (B), the fluorescent intensities (integrated density) divided by the areas of individual inclusions were graphed as mean and standard error of the mean using GraphPad Prism 7.0 software. Statistical significance was determined using an ordinary one-way ANOVA with Tukey's multiple comparisons post-test, with **** indicating p < 0.0001 and *** indicating p < 0.001. In statistical comparison of IncF-APEX2 induced with 5 nM aTc imaged at 25 hpi with indicated data points, & specifies p < 0.001 and && specifies p <0.0001.

