
FIG 4 .
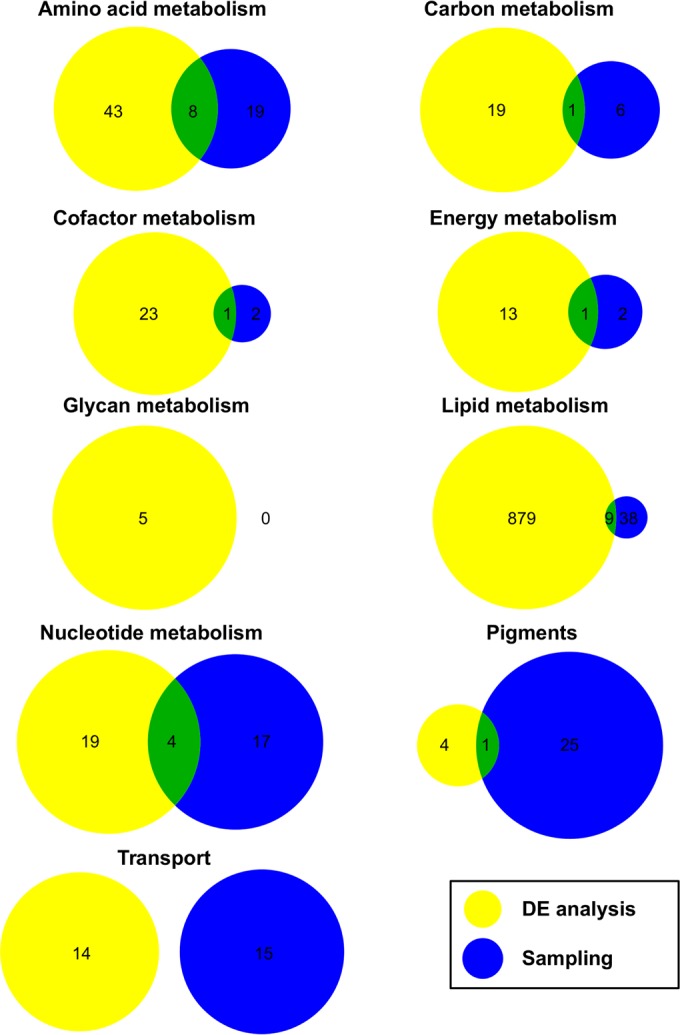
Comparison of reactions with different flux patterns. Reactions with different flux patterns (either up- or downregulated) at low and high carbon concentrations identified in the genome-scale metabolic model solution space sampling (blue) and the differential expression (DE, yellow) analysis are compared for each subsystem.