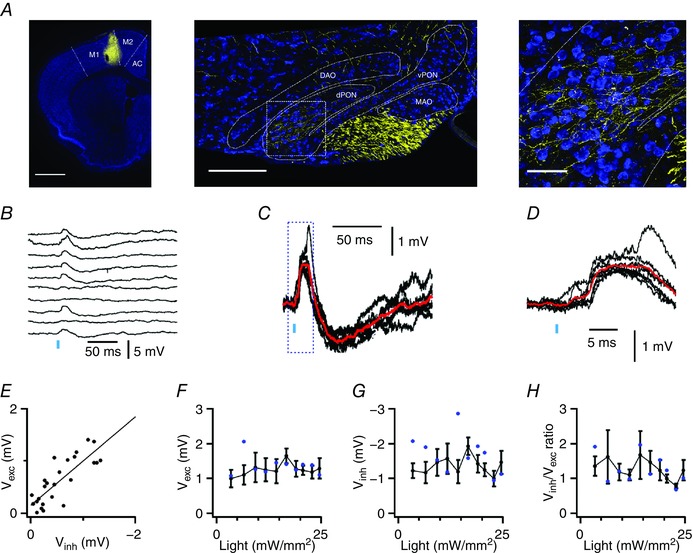
Figure 3. Bidirectional long‐range synaptic input to IO neurones.

A, coronal sections illustrate AAV‐ChR2‐Venus signal (yellow) in the motor cortex (left), in corticospinal tracts and principal olivary nucleus of the IO (middle), and in the IO at higher magnification (right). Scale bars are 1 mm (left), 200 μm (centre) and 50 μm (right). B, example responses of an IO neurone to optical activation of inputs from the motor cortex. C and D, traces from B overlaid and at a higher gain (C) and on a faster time scale (D). Average responses are in red. E, amplitude of individual inhibitory components are plotted as a function of the amplitude of the excitatory component for the recording in G. The line indicates linear regression (R 2 = 0.29, P = 2.4 × 10⁻⁴). F–H, V exc (F), V inh (G) and V inh/V exc (H) plotted as a function of stimulus intensity (n = 7 cells). Data from the neurone in B–E are shown as blue circles.
