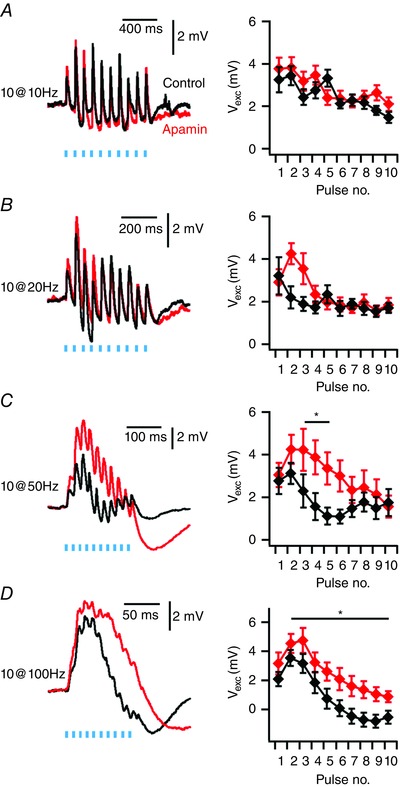
Figure 7. Temporal summation is enhanced by blocking the apamin‐sensitive component of postsynaptic responses.

A–D, examples of responses in Thy1‐ChR2‐YFP mice to trains of 10 stimuli delivered at 10 Hz (A), 20 Hz (B), 50 Hz (C) and 100 Hz (D) (left) and mean values of peak depolarization following each stimulus (right). Peak depolarization following each stimulus (V exc) during 50 and 100 Hz trains is increased by apamin (50 Hz: Condition F 1,80 = 4.736, P = 0.033; 100 Hz: Condition F 1,80 = 8.349, P = 0.005, n = 6, N = 6, two‐way ANOVA), but not at 10 and 20 Hz (10 Hz: Condition F 1,80 = 0.047, P = 0.829; 20 Hz: Condition F 1,80 = 0.047, P = 0.83, n = 6, N = 6, two‐way ANOVA). Data are presented as means ± SEM. * P < 0.05 control vs. apamin (Holm–Bonferroni post hoc comparison).
