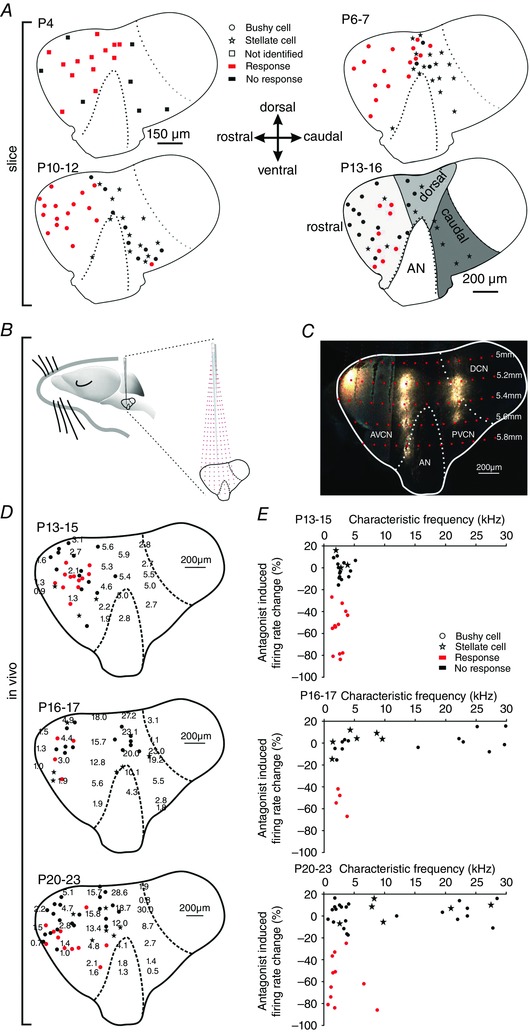
Figure 6. Purinergic modulation is cell‐specific and dependent on characteristic frequency.

A, parasagittal view to the CN of P4 (upper left), P6–7 (upper right), P10–12 (lower left), P13–16 (lower right) animals showing the positions of recorded cells. Red symbols indicate cell affected by puff application of αβ‐meATP (responders; *** P < 0.001, z test), black symbols non‐responders; stars show stellate cells. At P4, recorded cells are indicated by squares since they could not be unambiguously characterized as bushy or stellate. Grey areas on the P13–16 slice schematically depict the rostral, dorsal and caudal region. Cells from all ages were sorted accordingly. B, schematic drawing of the experimental approach used for tonotopic mapping in the cochlear nucleus complex. Red dashed lines show electrode trajectories targeting at different positions within the CN, red dots indicate the depth of the electrode penetration. C, parasagittal slice of the gerbil CN labelledin vivo with fluorogold at three rostro‐caudal penetration positions in 200 μm vertical steps. The image was generated by overlaying two medio‐laterally separated slices; the curvature of the CN along the rostro‐caudal axis precludes a visualization of the entire information in one slice. D, distribution of CFs (kHz) in P13–15 (upper panel), P16–17 (middle panel) and P20–23 cells (lower panel). Positions of BCs are indicated by closed circles, stellate cells by stars. Red dots show BCs with significant reduction of spontaneous firing during application of AF‐353 or TNP‐ATP (responders, z > 1.65); black dots show BCs not susceptible to antagonists (non‐responders). E, relative changes in firing rates upon application of P2X2/3R antagonist as a function of the CF of the unit. The effect on BCs depended on the CF of the unit (P16–17: P = 0.011, r s = 0.6; P20–23: P = 0.04, r s = 0.36; Spearman's rank order correlation). Note that none of the stellate cells were susceptible to P2X2/3R antagonists. [Colour figure can be viewed at wileyonlinelibrary.com]
