
Figure 1. Fetal biometry during gestation.
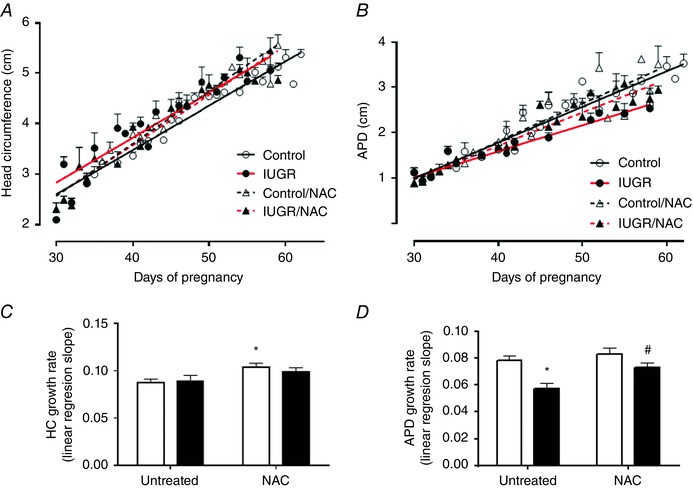
Ecographic determinations of head circumference (HC, A) and antero‐posterior diameter (APD, B) growth trajectory during gestation in control (open circles, continous black lines), control treated with NAC (open triangles, dashed black lines), IUGR (solid circles, continous red lines) and IUGR treated with NAC (solid triangles, dashed red lines) fetal guinea pigs. HC (C) and APD (D) growth rate slope in control (open bars) and IUGR (solid bars) with (treated) or without (untreated) NAC treatment. Values are expressed as mean ± SEM, * P < 0.05 vs untreated control, # P < 0.05 vs untreated IUGR, ANCOVA. [Colour figure can be viewed at wileyonlinelibrary.com]