
Figure 3. Levels of protein peroxynitration in fetal aorta.
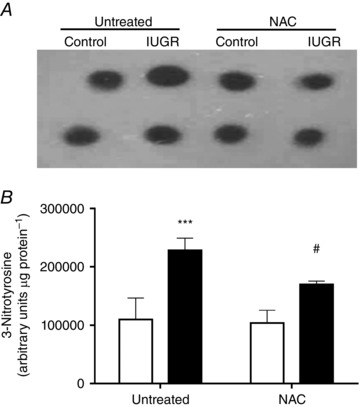
Representative blot (A) and relative levels (B) of 3‐nitrotyrosine determined by dot blot in whole protein extract from fetal aorta of control (open bars, n = 6) and IUGR (solid bars, n = 7) guinea pigs without (untreated) or with (NAC) maternal antioxidant supplementation. Values expressed as mean ± SEM, *** P < 0.001 vs untreated‐control, # P < 0.05 vs untreated‐IUGR, two‐way ANOVA, Newman–Keuls multiple comparison test.