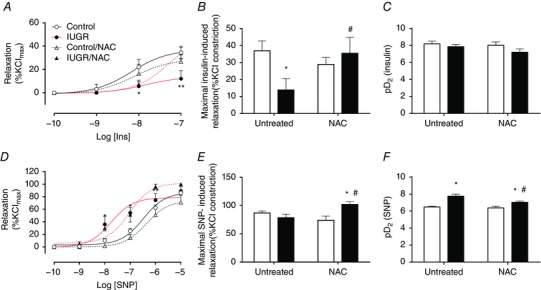
Figure 5. Endothelial‐dependent and independent relaxation of isolated umbilical arteries.

A–C, cumulative concentration relaxation curve (A), maximal response (B) and sensitivity (C) to insulin in isolated umbilical arteries. D–F, cumulative concentration relaxation curve (D), maximal response (E) and sensitivity (F) to the NO donor SNP in isolated umbilical arteries. Groups are control (open circles, continuous black lines), control treated with NAC (open triangles, dash black lines), IUGR (solid circles, continous red lines) and IUGR treated with NAC (solid triangles, dash red lines) fetal guinea pigs. Values expressed as mean ± SEM, *P < 0.05, **P < 0.01 vs untreated control, #P < 0.05 vs untreated IUGR, two‐way ANOVA, Newman–Keuls multiple comparison test. [Colour figure can be viewed at wileyonlinelibrary.com]
