
Figure 7. Levels of mRNA for eNOS in primary cultures of guinea pig fetal artery endothelial cells.
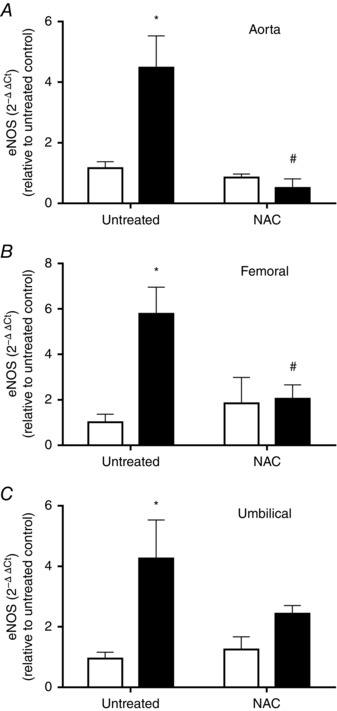
Levels of eNOS mRNA in primary cultures of fetal ECs from aorta (A), femoral (B) and umbilical (C) arteries in control (open bars) and IUGR (solid bars) guinea pig groups whose mothers received (NAC) or did not receive (untreated) antioxidant treatment. Values expressed as mean ± SEM, * P < 0.05 vs untreated control, # P < 0.05 vs untreated IUGR, two‐way ANOVA, Newman–Keuls multiple comparison test.