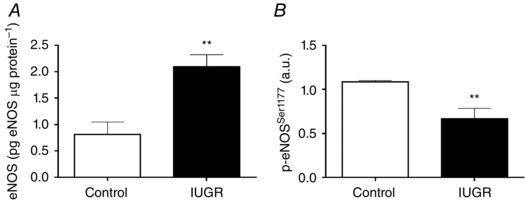
Figure 8. Levels of eNOS protein in umbilical artery endothelial cells.

Total eNOS protein levels (A) and relative levels of eNOS (B) activating phosphorylation in ECs from control (n = 5) and IUGR (n = 4) fetuses quantified by ELISA. Values expressed as mean ± SEM, ** P < 0.01 vs control, Mann–Whitney U test.
