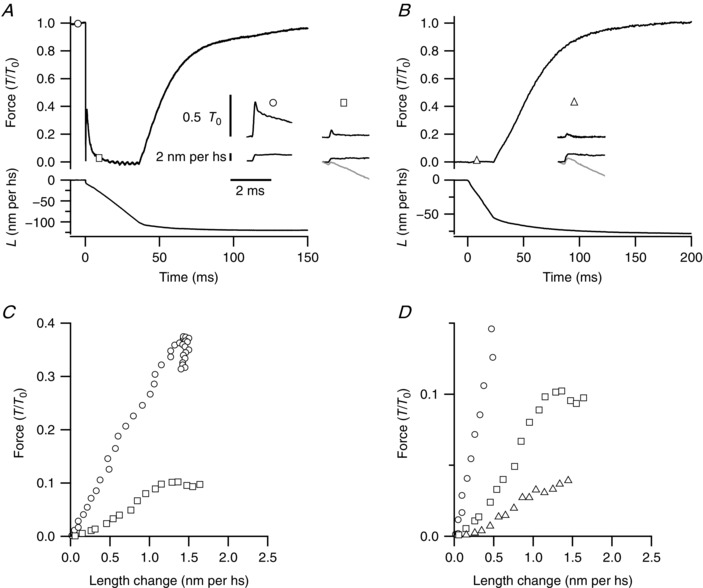
Figure 5. Force and hs sarcomere length responses to a step stretch imposed on a contracting fibre.

A, time course of force (T/T 0, upper trace) and hs length change (L, lower trace) in response to a ramp‐faced shortening at V 0 (amplitude ∼10% of the initial fibre length, plus a 0.8% step release) applied at T 0. Time 0 corresponds to the start of shortening. The circle and the square on the force trace mark the time (T 0 and 8 ms of V 0 shortening, respectively) at which the step stretches, shown in the inset, are imposed in subsequent contractions. In the inset, L for the step stretch superimposed on V 0 shortening (black) was obtained from the original trace (grey) by subtracting the L trace from a contraction without step stretch. B, time course of force (upper trace) and L (lower trace) in response to a ramp‐faced shortening at V 0 (amplitude ∼5% of the initial fibre length), imposed at the end of the LR, taken as time zero. The triangle on the force trace marks the time (8 ms after the start of shortening) at which the step stretch, shown in the inset, is imposed in a subsequent contraction. C, superimposed force–L plots during the step stretches in A, as defined by the symbols. Time resolution 5 μs per point. D, superimposed force–L plots during the step stretches in A and B, as defined by the symbols. Note that the vertical scale is amplified about three times relative to C.
