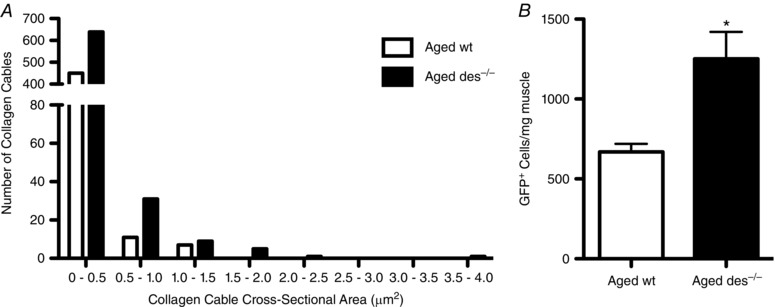
Figure 5. The number of collagen cables is increased in aged des−/− muscle and aged des−/− muscle contains more collagen producing cells.

A, the number of collagen cables was counted and the cross‐sectional area of each cable estimated for collagen cables identified on high magnification transmission electron micrographs used for stereological analysis. The total number of cables was 468 (aged wild‐type) and 686 (aged des−/−) and the cross‐sectional area distribution shape was similar between genotypes (n = 8). Medians were found to be significantly different by a Mann–Whitney test (non‐parametric) at 0.041 μm2 for wild‐type vs. 0.029 μm2 for des−/− (P < 0.05). Therefore, the increased volume fraction of collagen cables in des−/− muscle is due to an increase in cable number, not size. B, type I collagen reporter mice were generated in which cells that produce collagen are positively labelled with GFP. GFP expressing cells from aged wt (n = 16) and aged des−/− (n = 4) were sorted and counted by FACS analysis and normalized to muscle mass (Chapman et al. 2016). GFP+ cells were significantly increased in aged des−/− muscle. Means ± standard error of the mean; * P < 0.05 (two‐tailed t test).
