
Figure 2. Intensity‐dependent effects in motor‐cortical excitability following anodal tDCS.
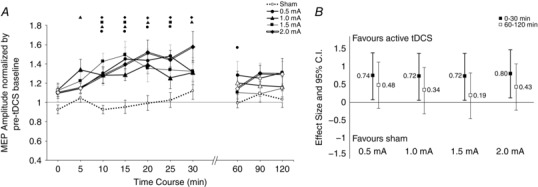
A, after‐effects of cortical excitability following 15 min of anodal stimulation at intensities ranging from sham to 2.0 mA on the mean MEP amplitude. Error bars represent standard error. Filled symbols indicate a significant difference in cortical excitability against the respective baseline (Student's paired t test, two‐tailed, P < 0.05). Floating symbols (●, 0.5; ▲, 1.0; ■, 1.5; ◆, 2.0 mA) indicate a significant difference between the active intensity and sham stimulation (paired t test, two‐tailed, P < 0.05). Anodal stimulation over all active intensities resulted in significant increases of excitability lasting up to 30 min. Sham stimulation did not induce any significant change in cortical excitability. B, effect sizes and 95% confidence intervals of active tDCS intensities versus sham. MEP amplitudes were averaged into two time bins of early (0–30 min) and late (60–120 min) excitability changes, followed by calculation of Cohen's effect size d. Error bars represent 95% confidence intervals based on the pooled variance. Differences between active intensities were generally not discernable in the first 30 min; however, 0.5 and 2.0 mA resulted in slightly larger effects, especially in the time window 60–120 min.