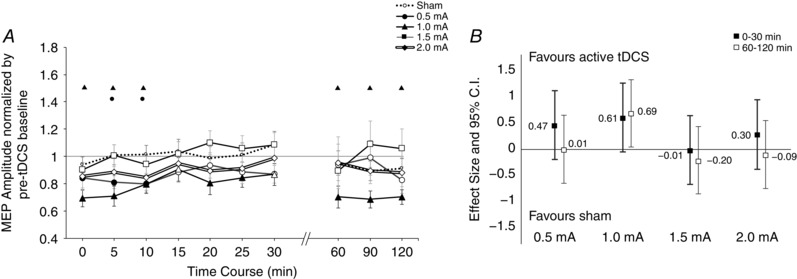
Figure 3. Intensity‐dependent effects in motor‐cortical excitability following cathodal tDC.

A, after‐effects of cortical excitability following 15 min of cathodal stimulation at intensities ranging from sham to 2.0 mA on the mean MEP amplitude. Error bars represent standard error. Filled symbols indicate a significant difference in cortical excitability against the respective baseline (paired t test, two‐tailed, P < 0.05). Floating symbols (●, 0.5; ▲, 1.0; ■, 1.5; ◆, 2.0 mA) indicate a significant difference between the active intensity and sham stimulation (paired t test, two‐tailed, P < 0.05). Only 0.5 mA and 1.0 mA cathodal stimulation resulted in significant differences from baseline, and only 1.0 mA was significantly different from sham during the early time bins. Higher intensities such as 1.5 and 2.0 mA (the latter is highlighted with double lines) tended to return to baseline values after about 10 min. Sham stimulation did not induce any significant change in cortical excitability. B, effect sizes and 95% confidence intervals of active tDCS intensities versus sham. MEP amplitudes were averaged into two time bins of early (0–30 min) and late (60–120 min) excitability changes, followed by calculation of Cohen's effect size d. Error bars represent 95% confidence intervals based on the pooled variance. Note that larger effects correspond to greater reduction of excitability from baseline (see Methods). Greatest differences are again seen with lower intensities of 0.5 and 1.0 mA whereas higher intensities did not result in marked changes.
